Colored Figures

Colored Figures |
|
| Bifurcation Diagrams (blue: stable, green: unstable, red: bifurcation point) | |
| Example 1.7 | Lorenz Equation (pages 23-26, 85-92, Fig.2.35) pdf jpg gif |
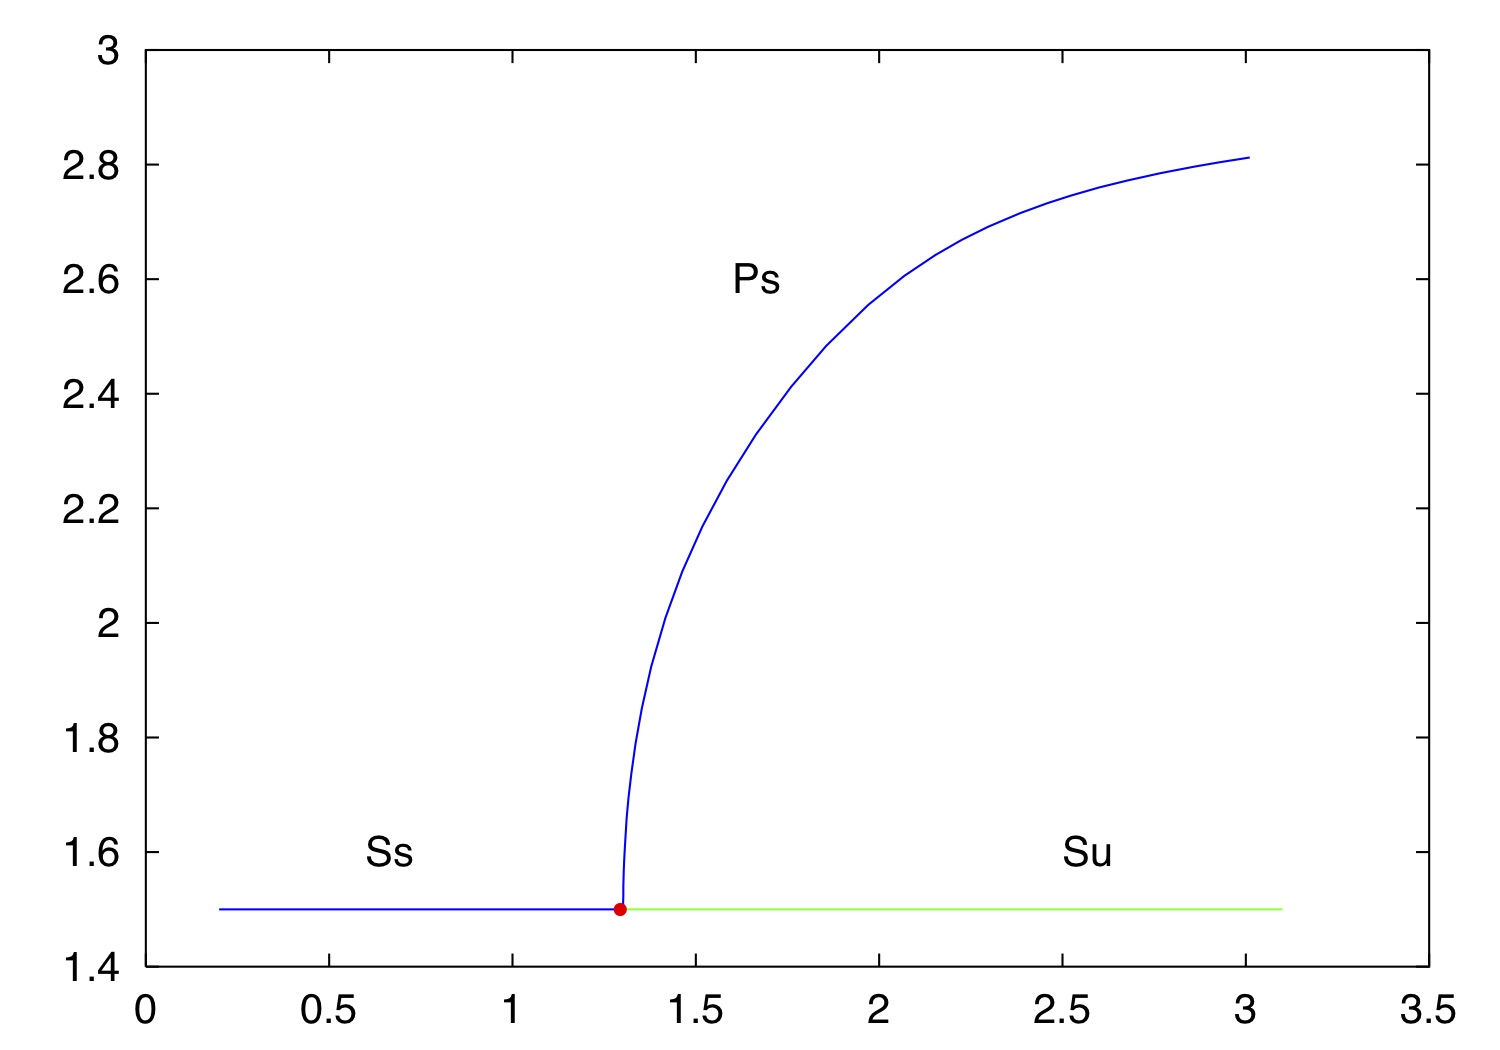
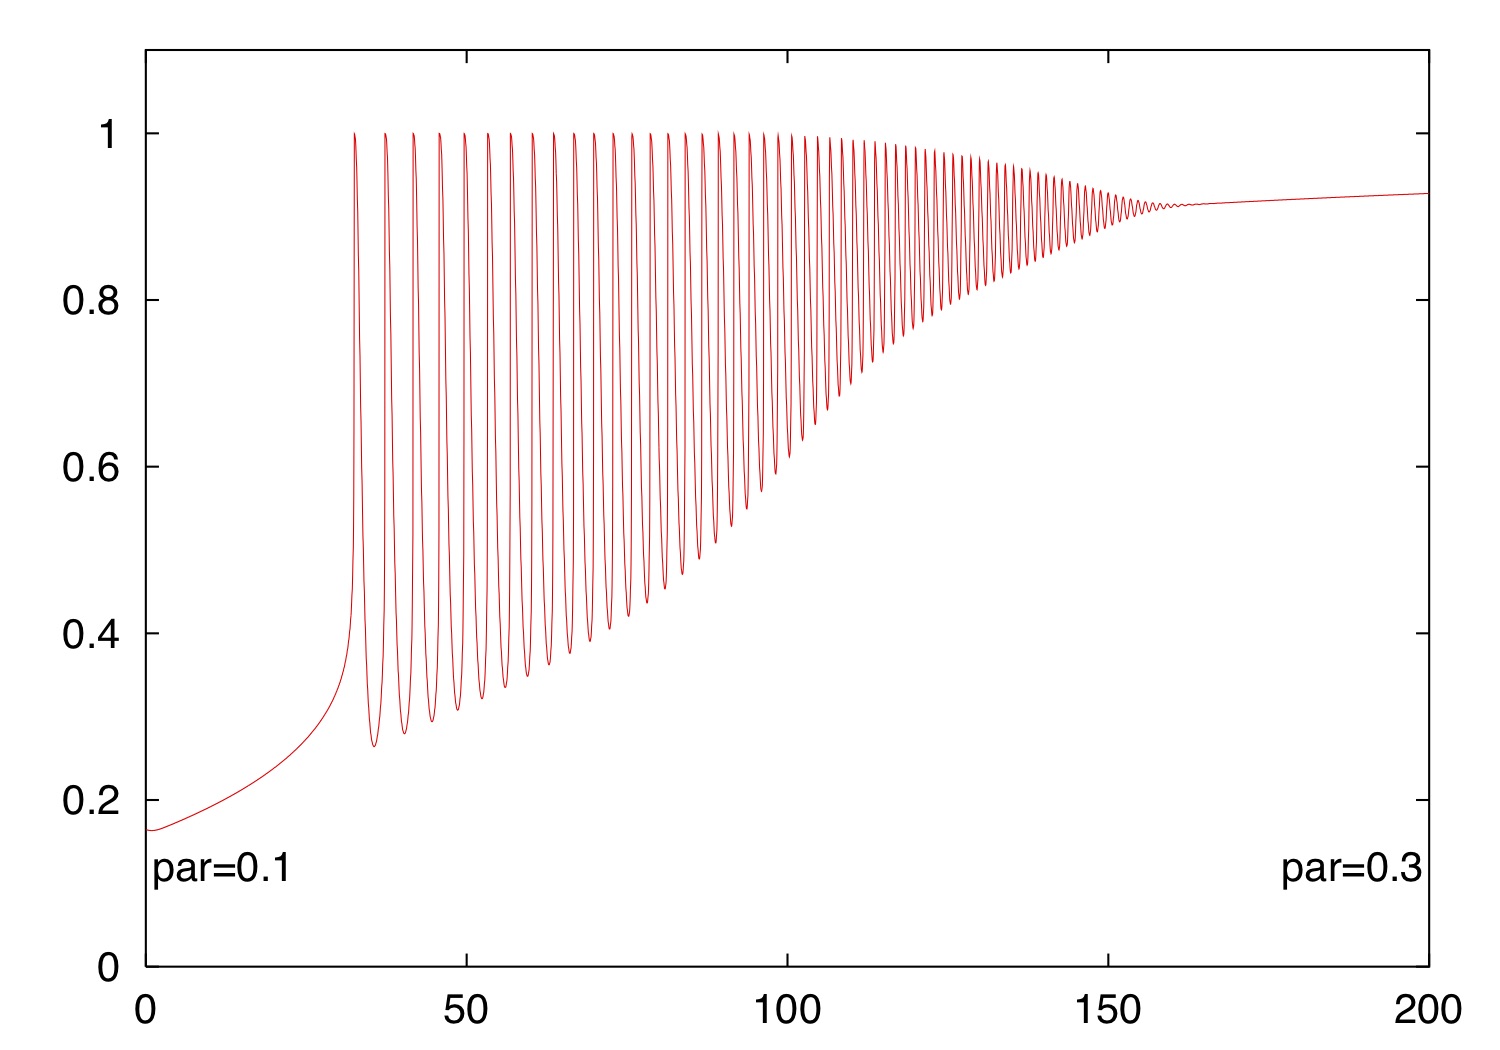
| Example 2.14 | CSTR (pages 97-99, Fig.2.43) pdf jpg gif |
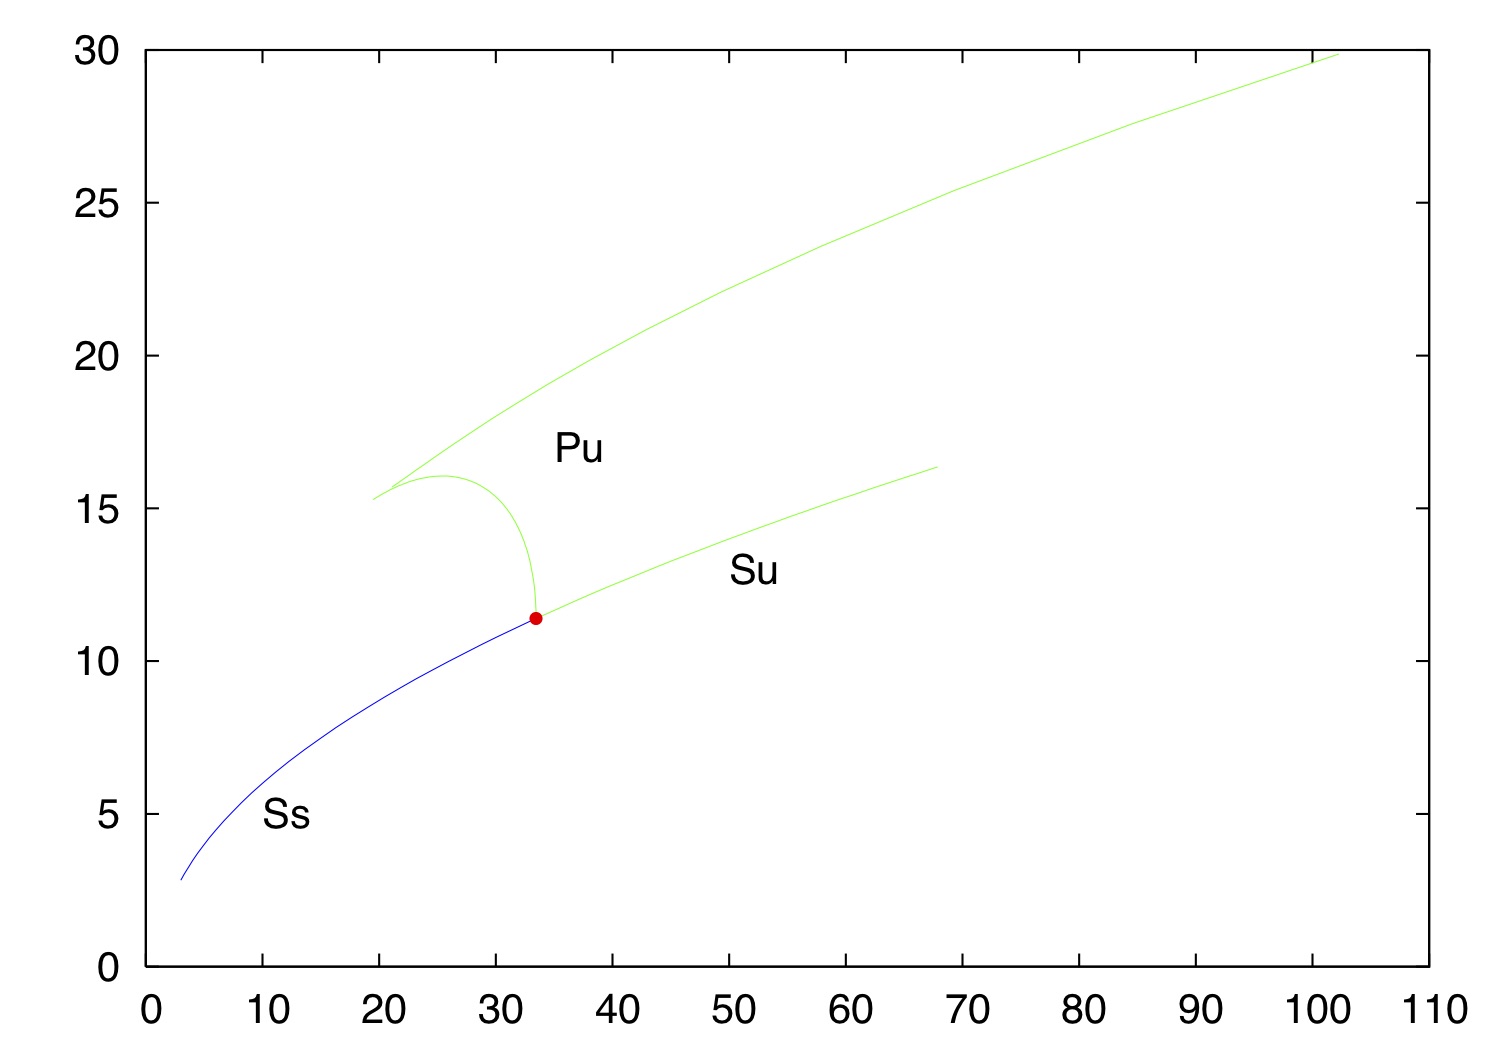
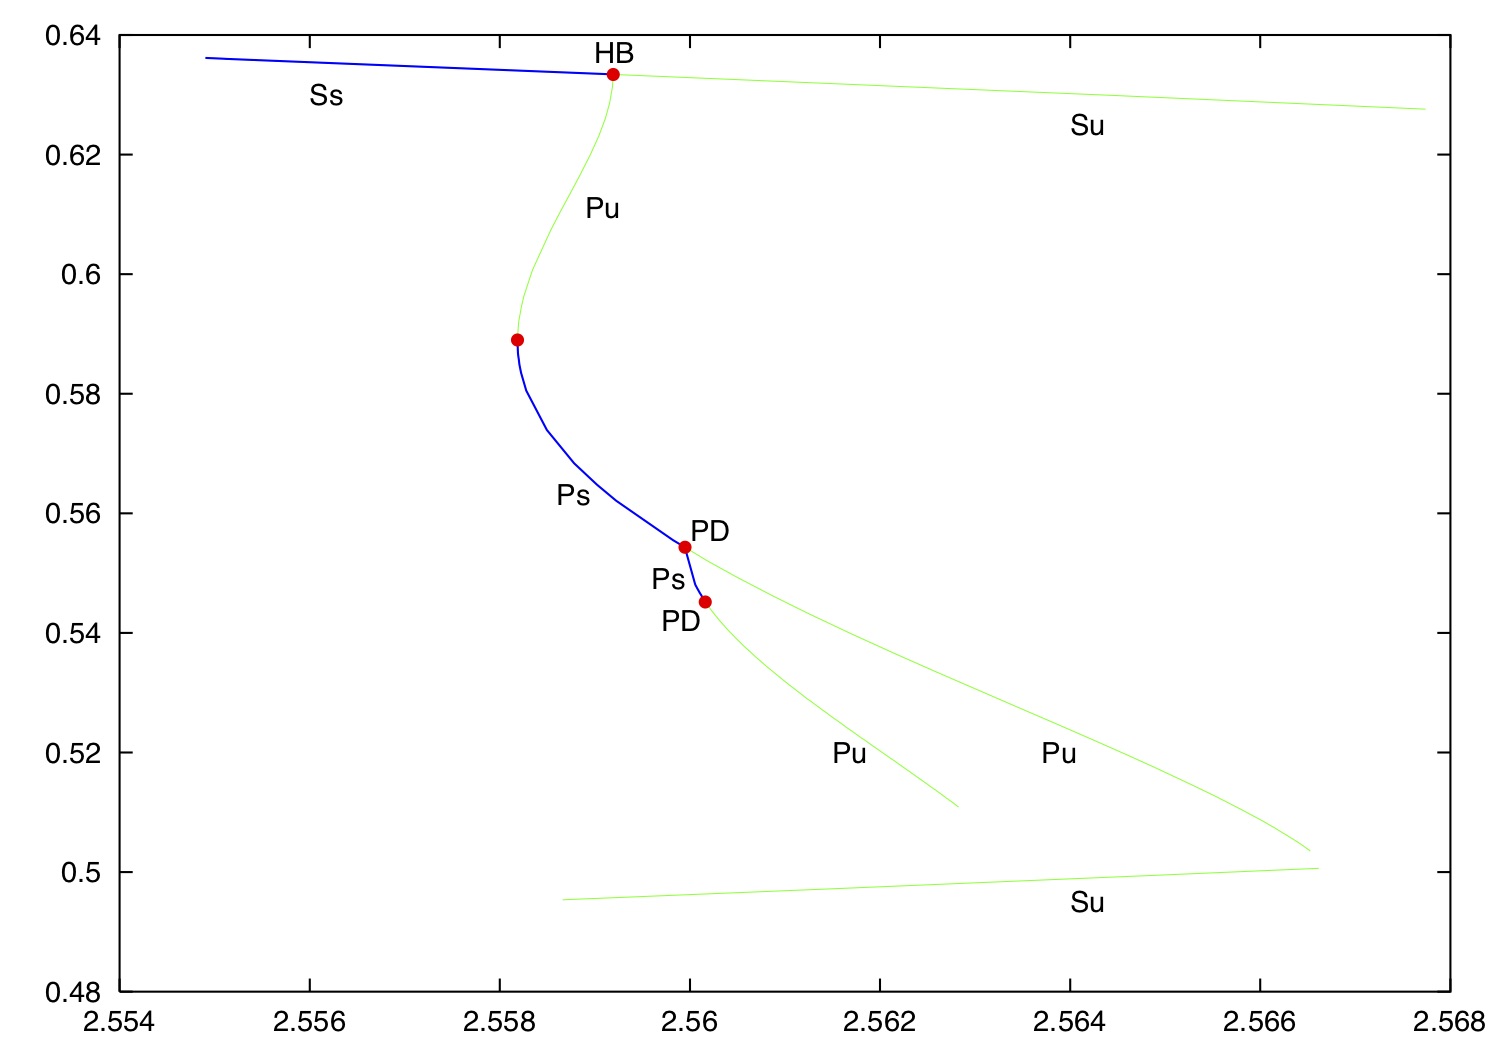
| Example 3.8 | Voltage Collapse (pages 159-161, Fig.3.26) pdf jpg gif |
| Example 6.1 | Brusselator (pages 264-266, Fig. 6.1) pdf jpg |
| Example 6.2 | Duffing Eq.(pages 266-271, Fig. 6.2) pdf jpg |
| Example 6.2 | (detail) pdf jpg |
| Example 6.4 | superconductivity (pages 280-284, Fig. 6.10) pdf jpg |
| Example 6.6 | buckling of a rod (pages 286-287, Fig. 6.12) pdf jpg |
| Example 7.6 | two coupled Brusselators (pages 318-321, Fig. 7.13) pdf jpg |
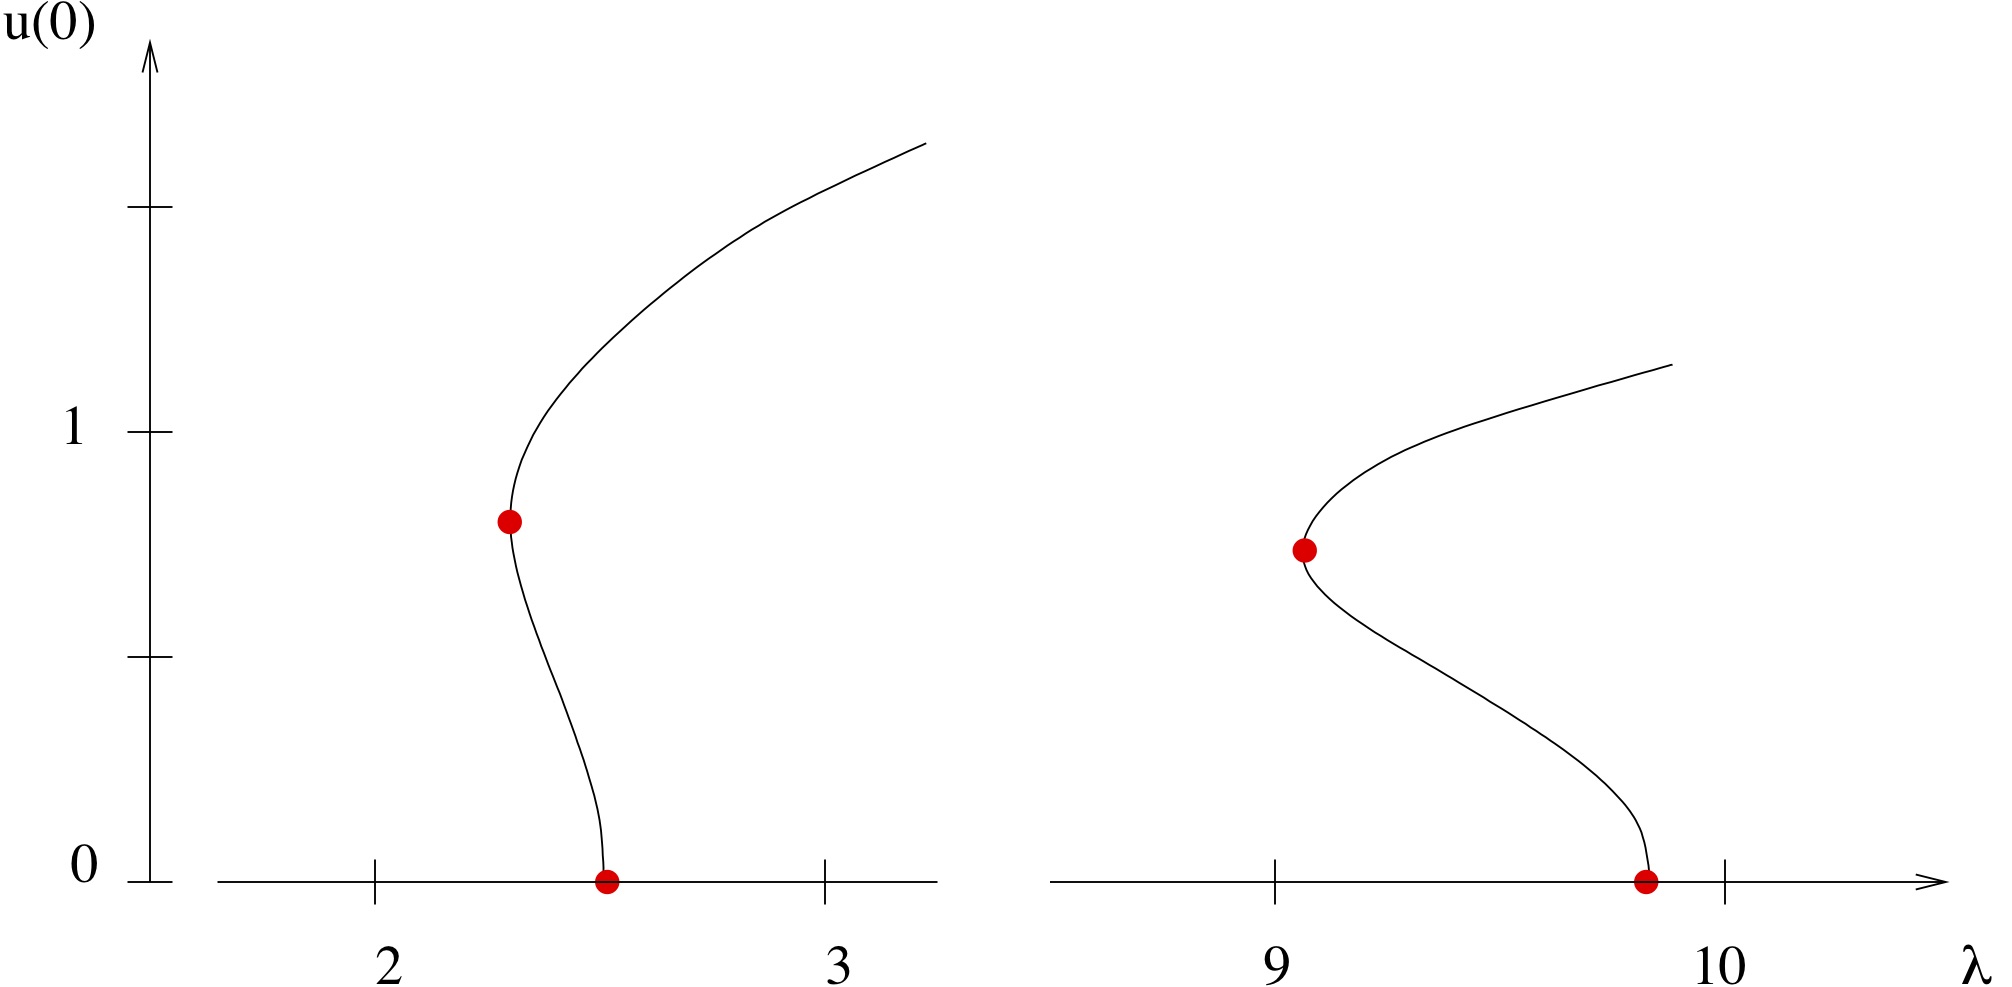
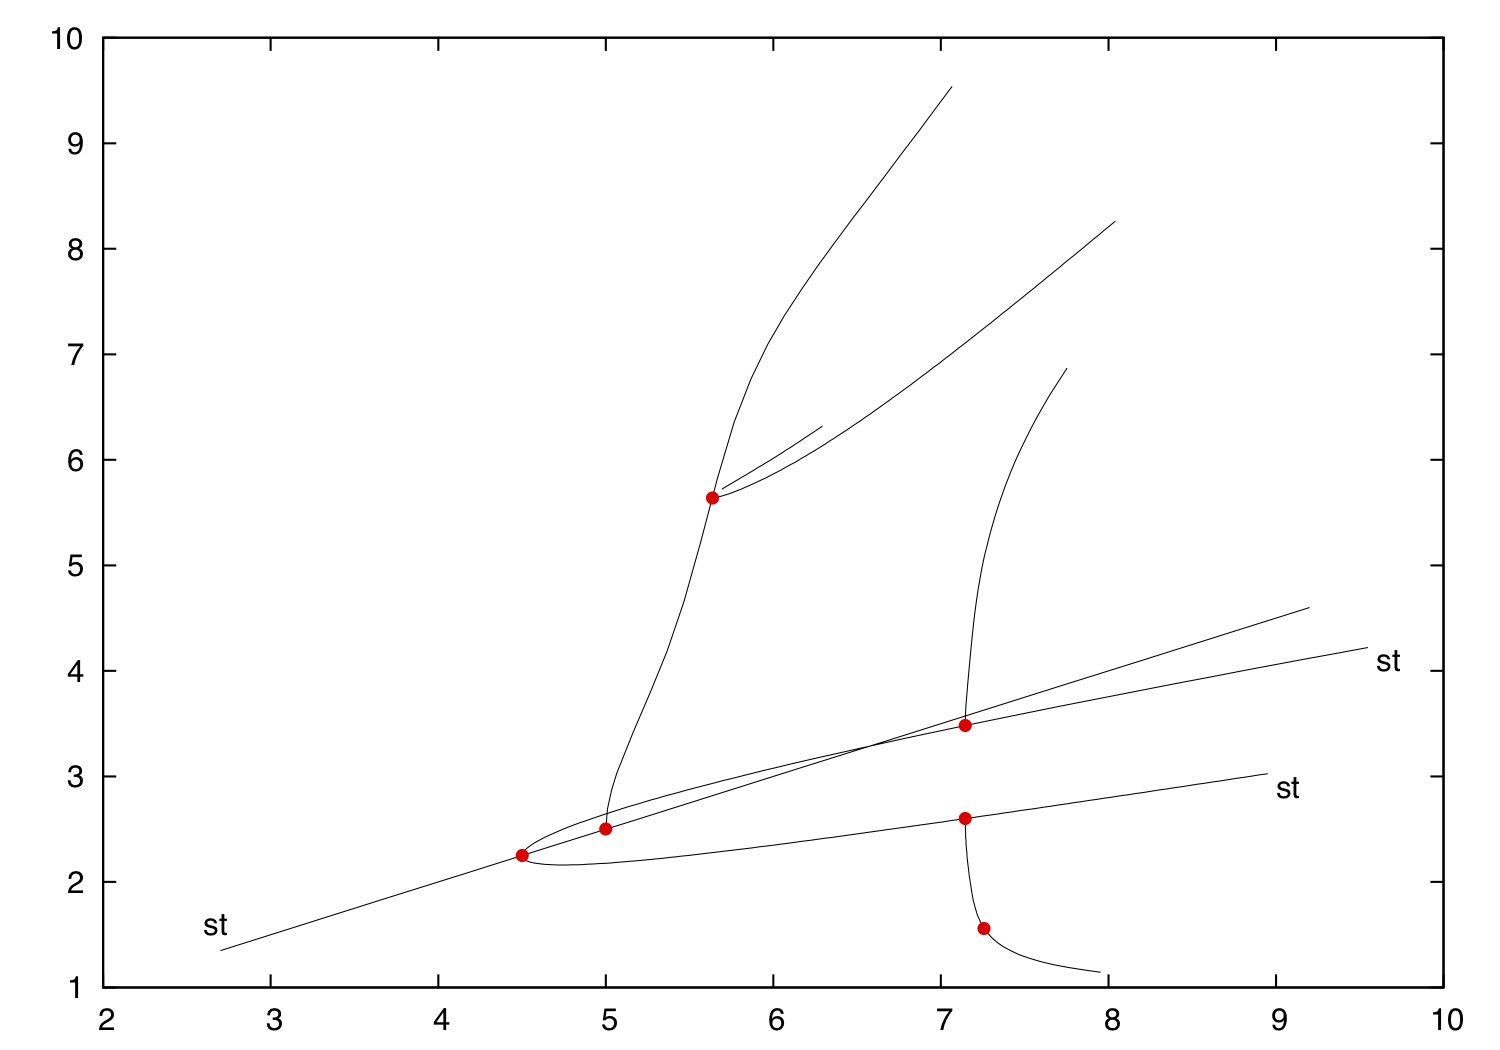
| Example 7.8 | Isothermic Reaction (pages 325-326, Fig. 7.17) pdf jpg gif |
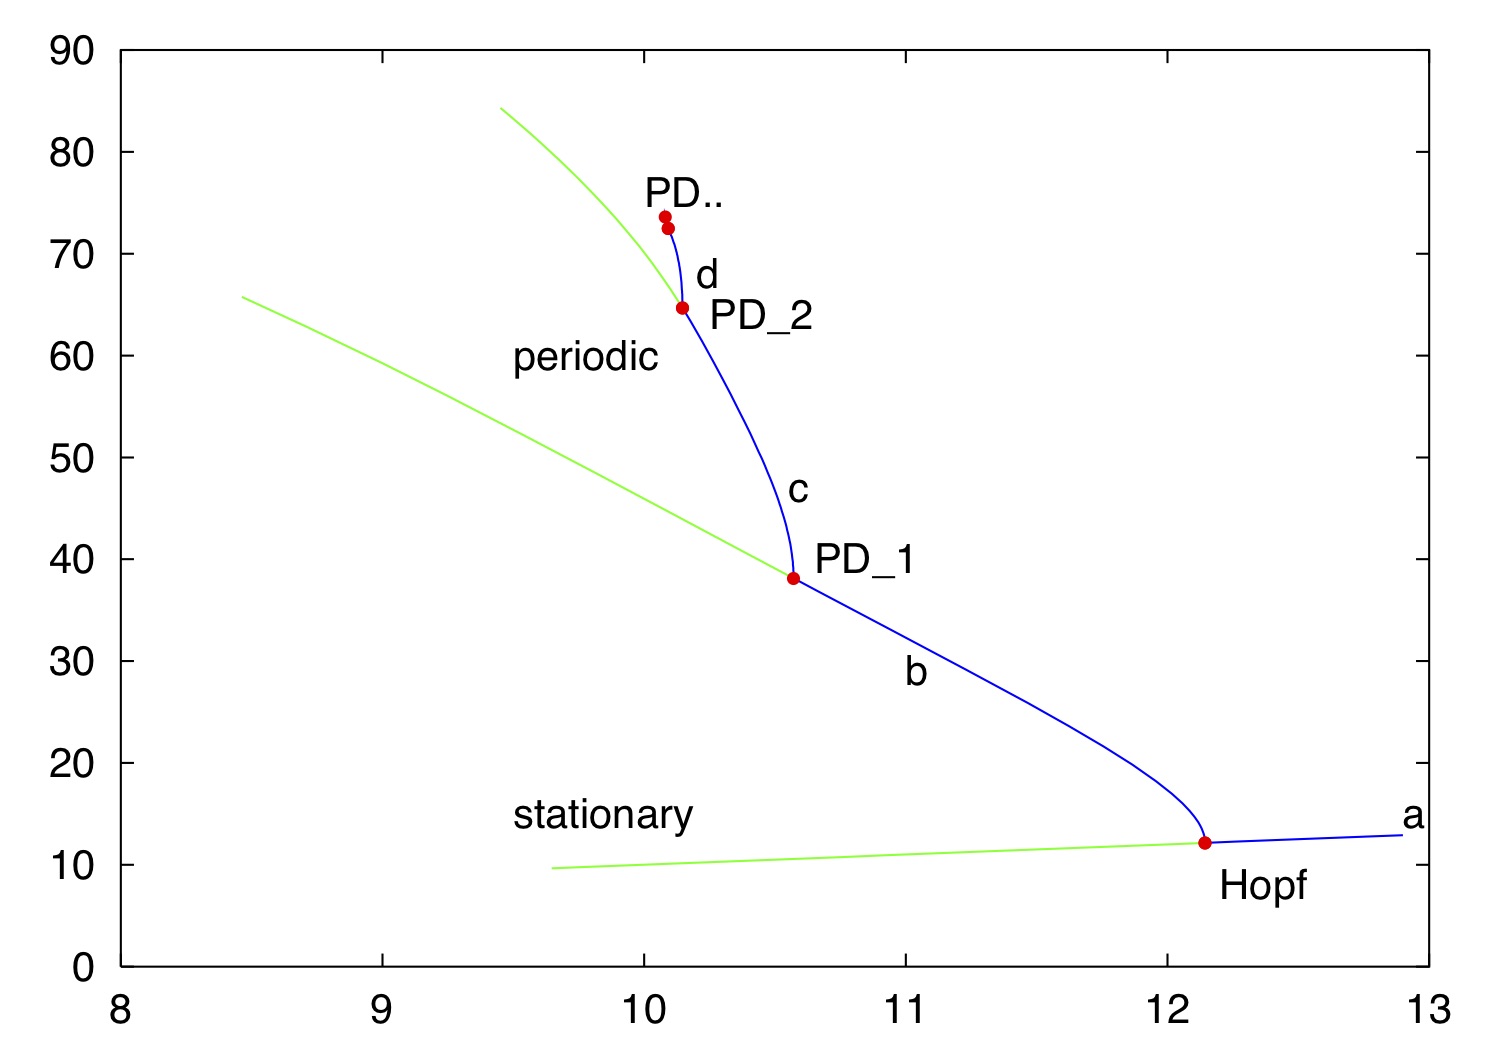
| Example 7.15 | Autocatalytic Reaction (pages 342-344) pdf jpg gif |
| CSTR stirred tank reactor (Example 2.14, page 97) | |
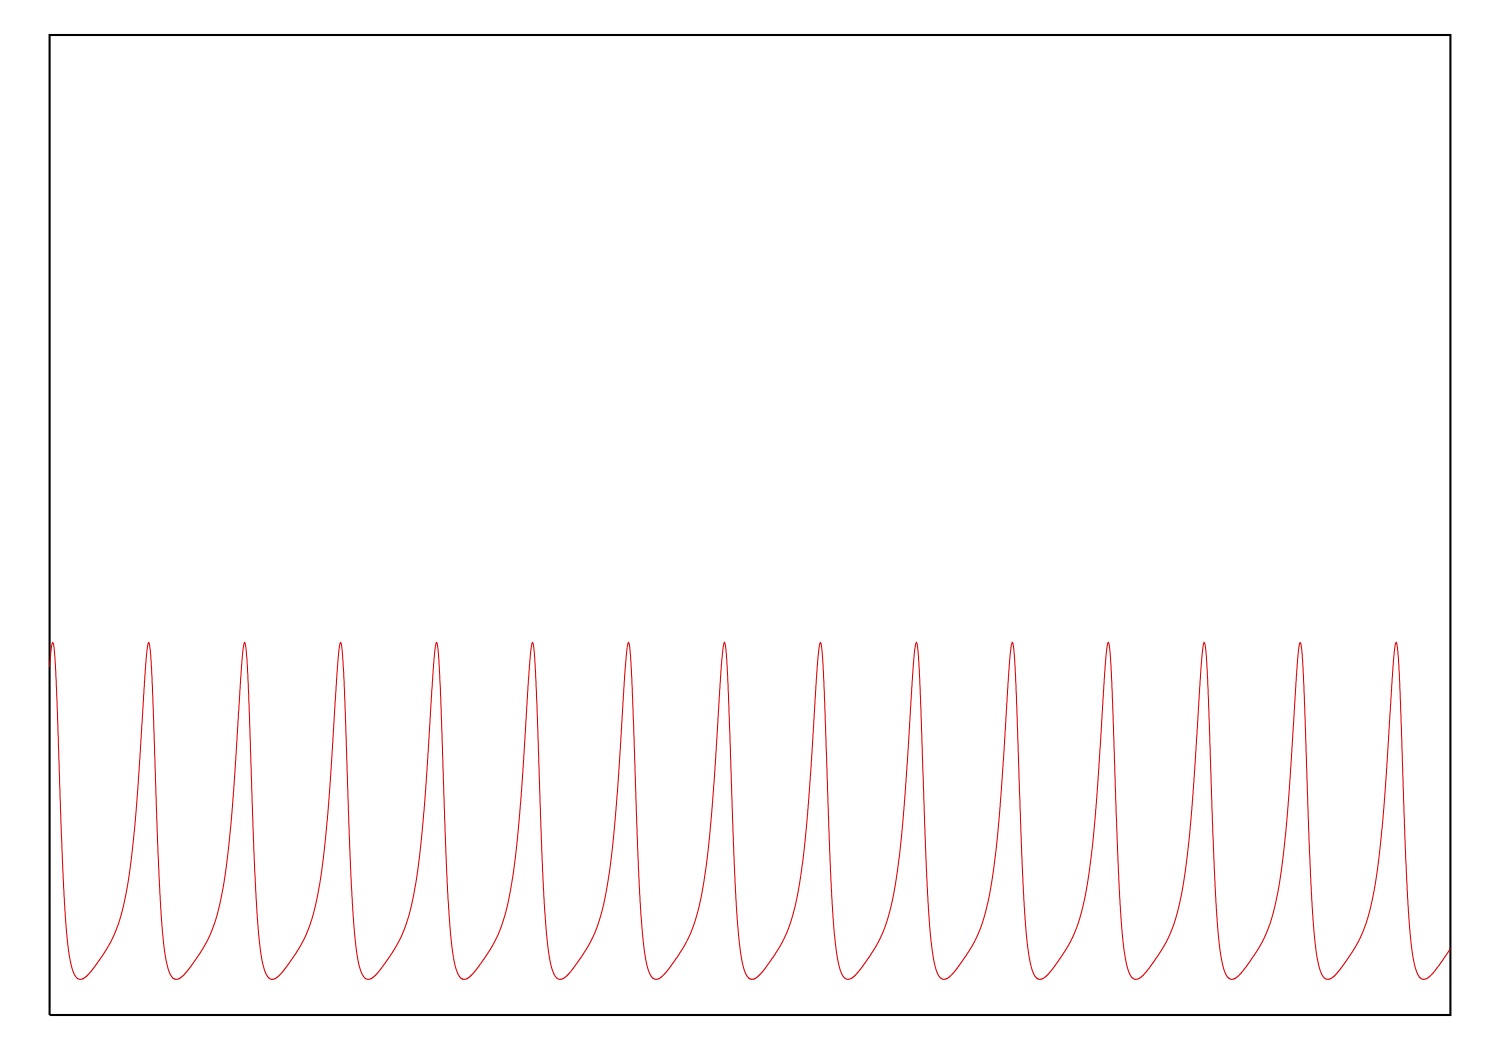
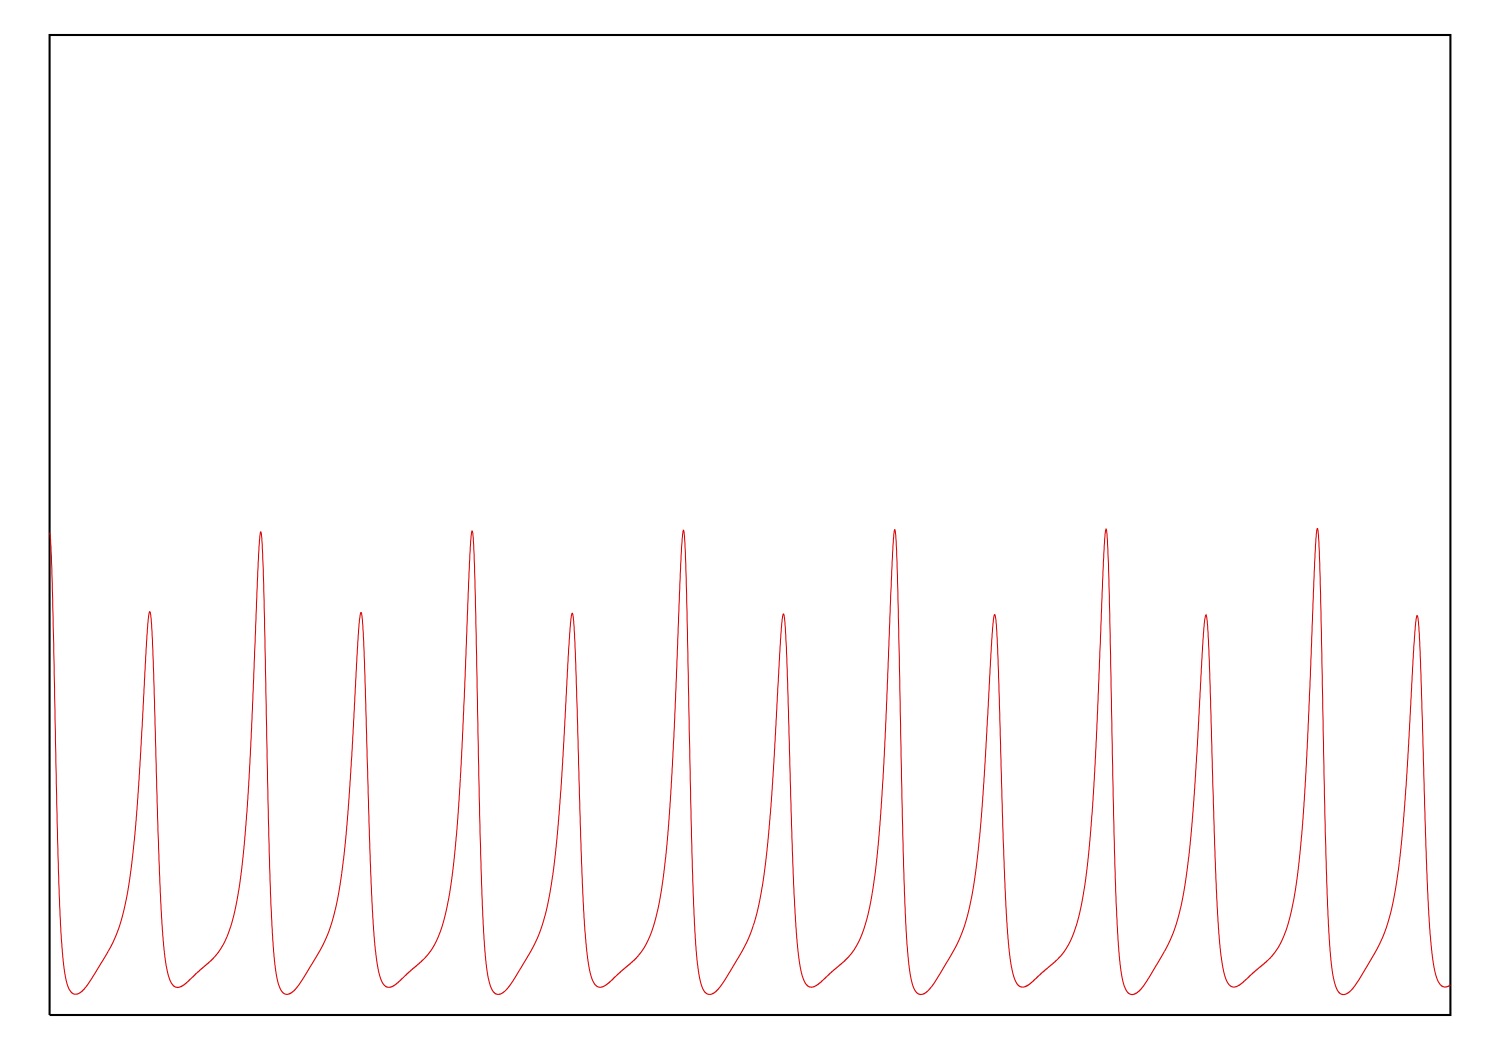
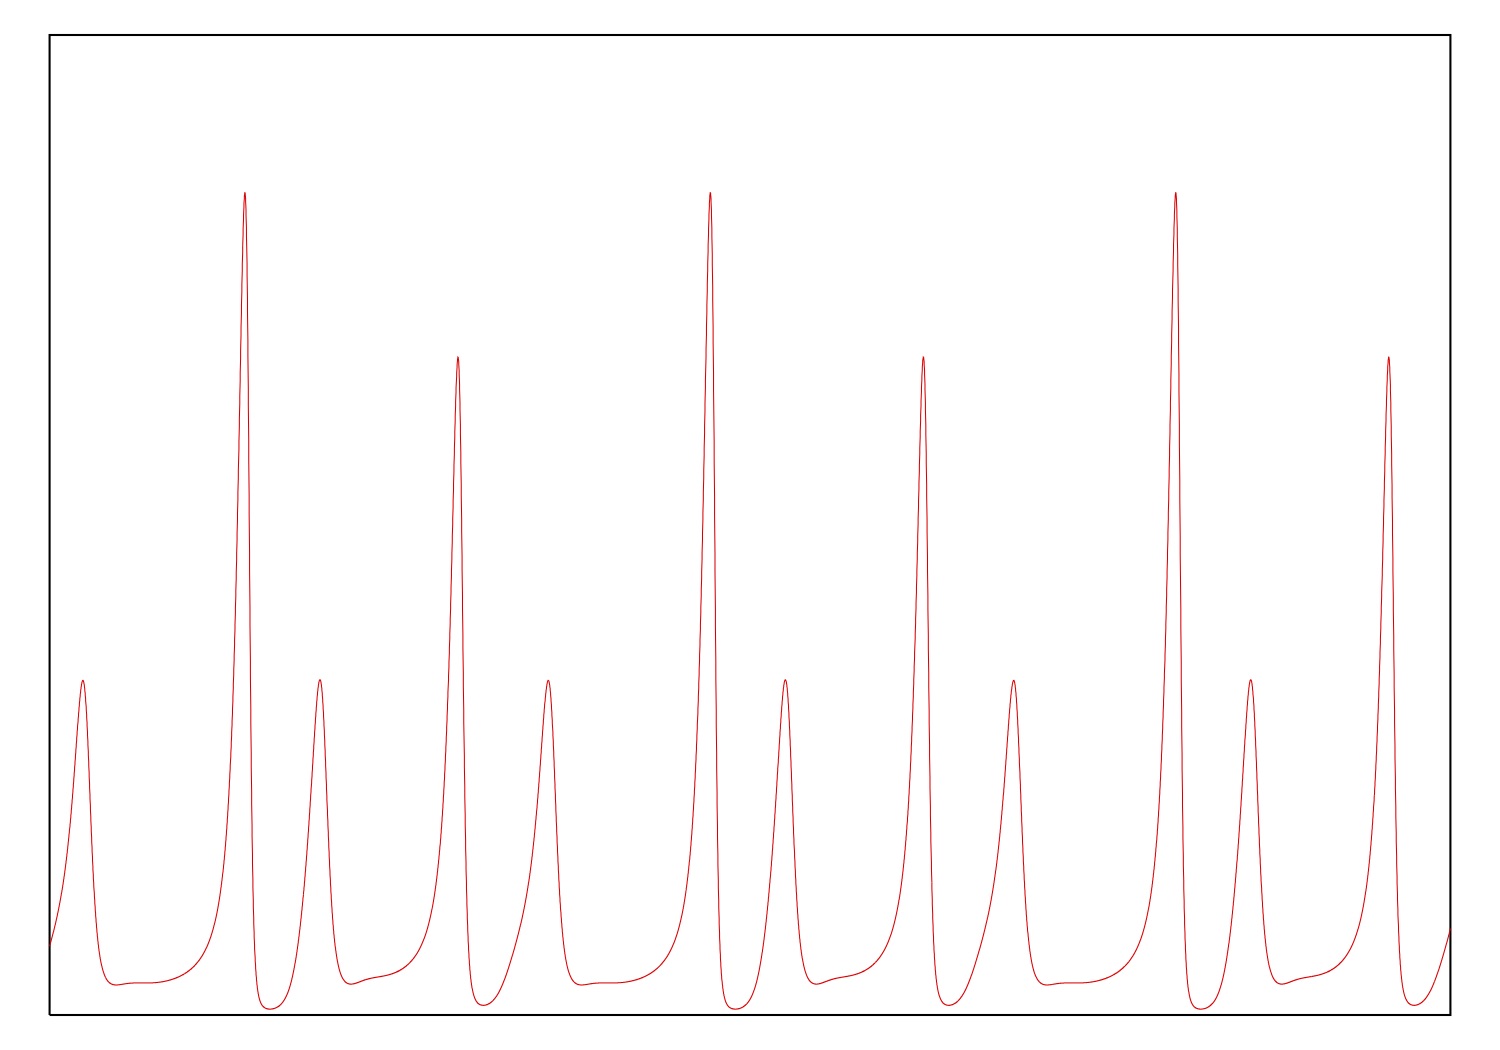
| Figure 1.3 | y_1(t) for parameter growing from 0.1 to 0.3 pdf jpg gif |
| Figure 2.43 | bifurcation diagram pdf jpg gif |
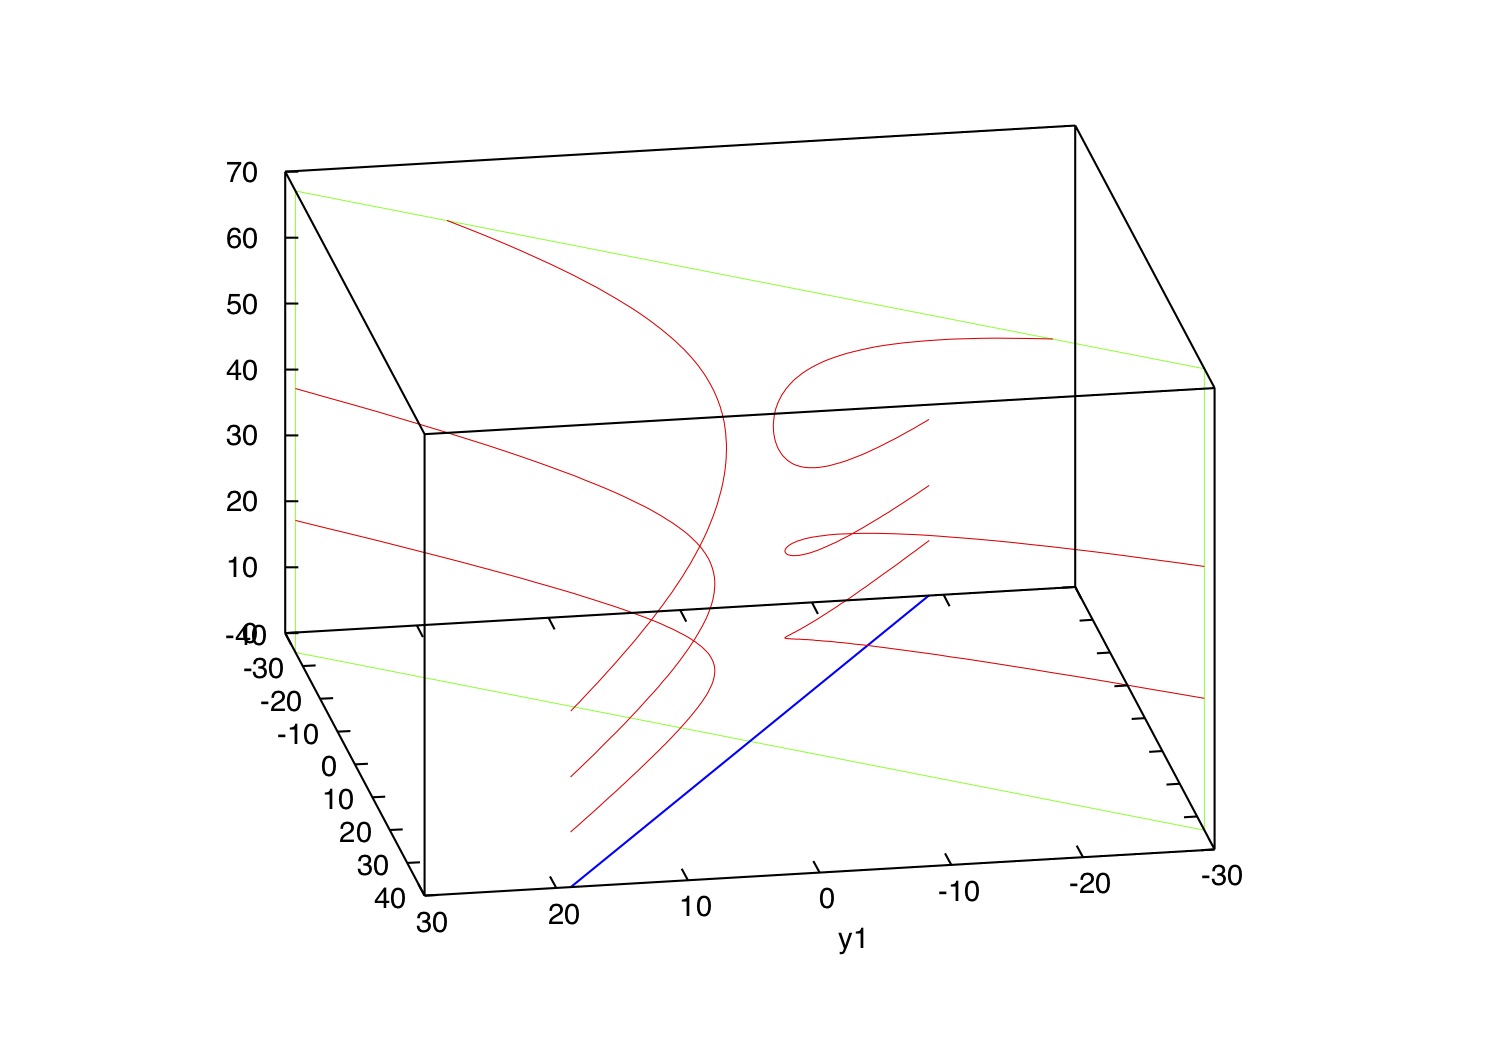
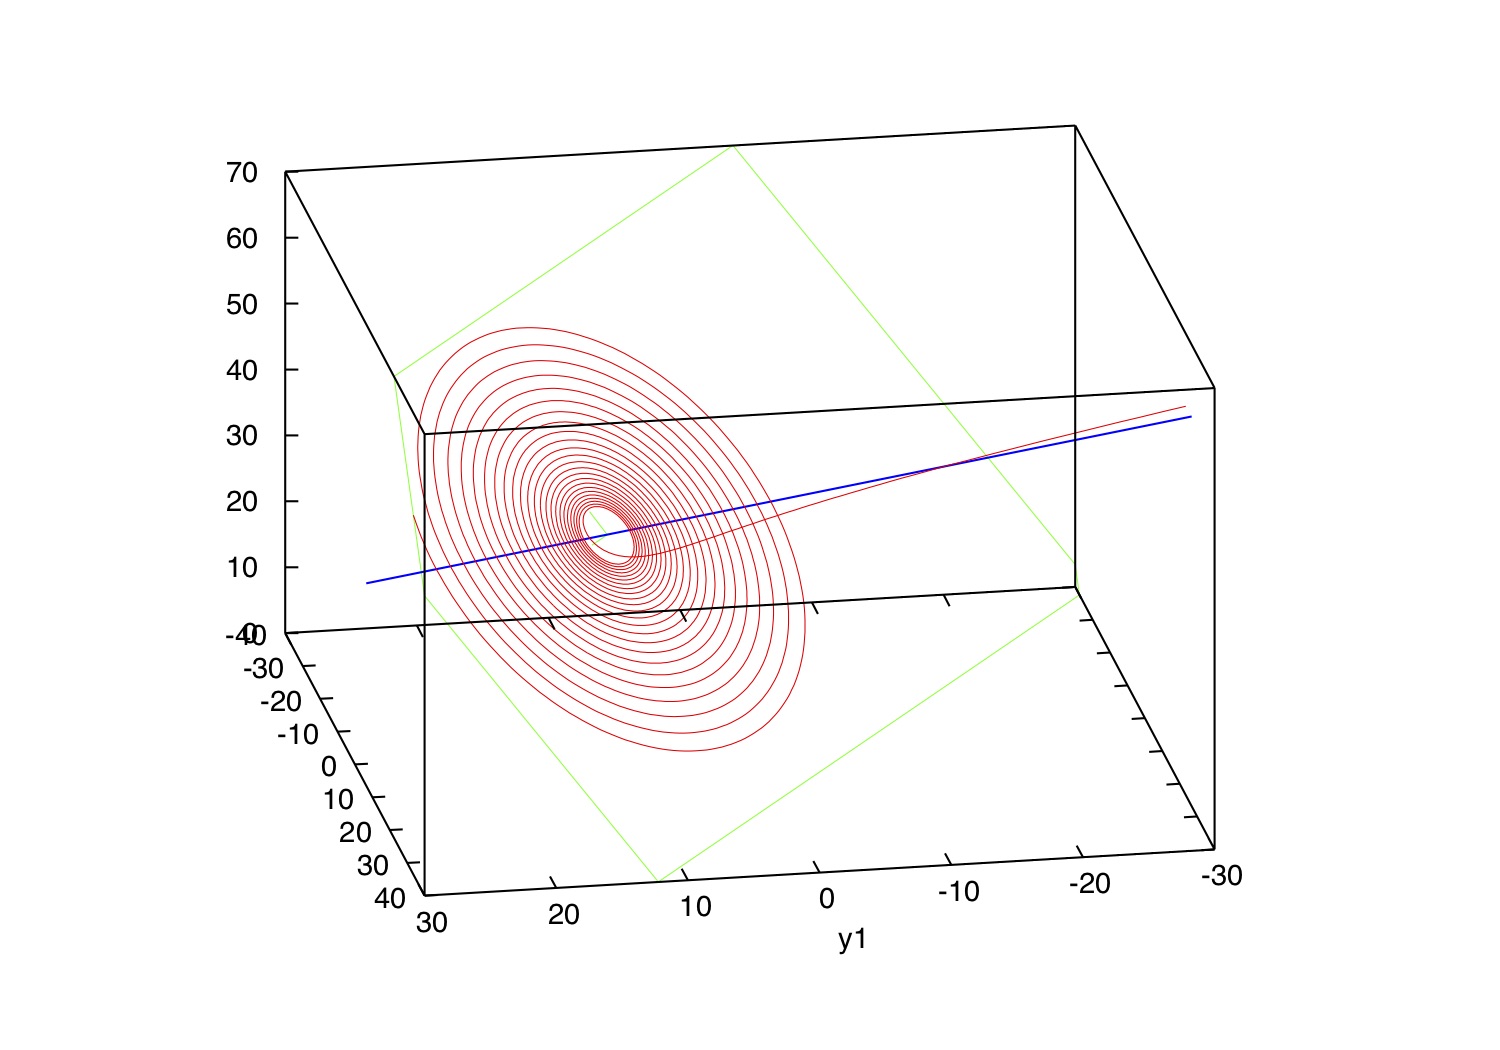
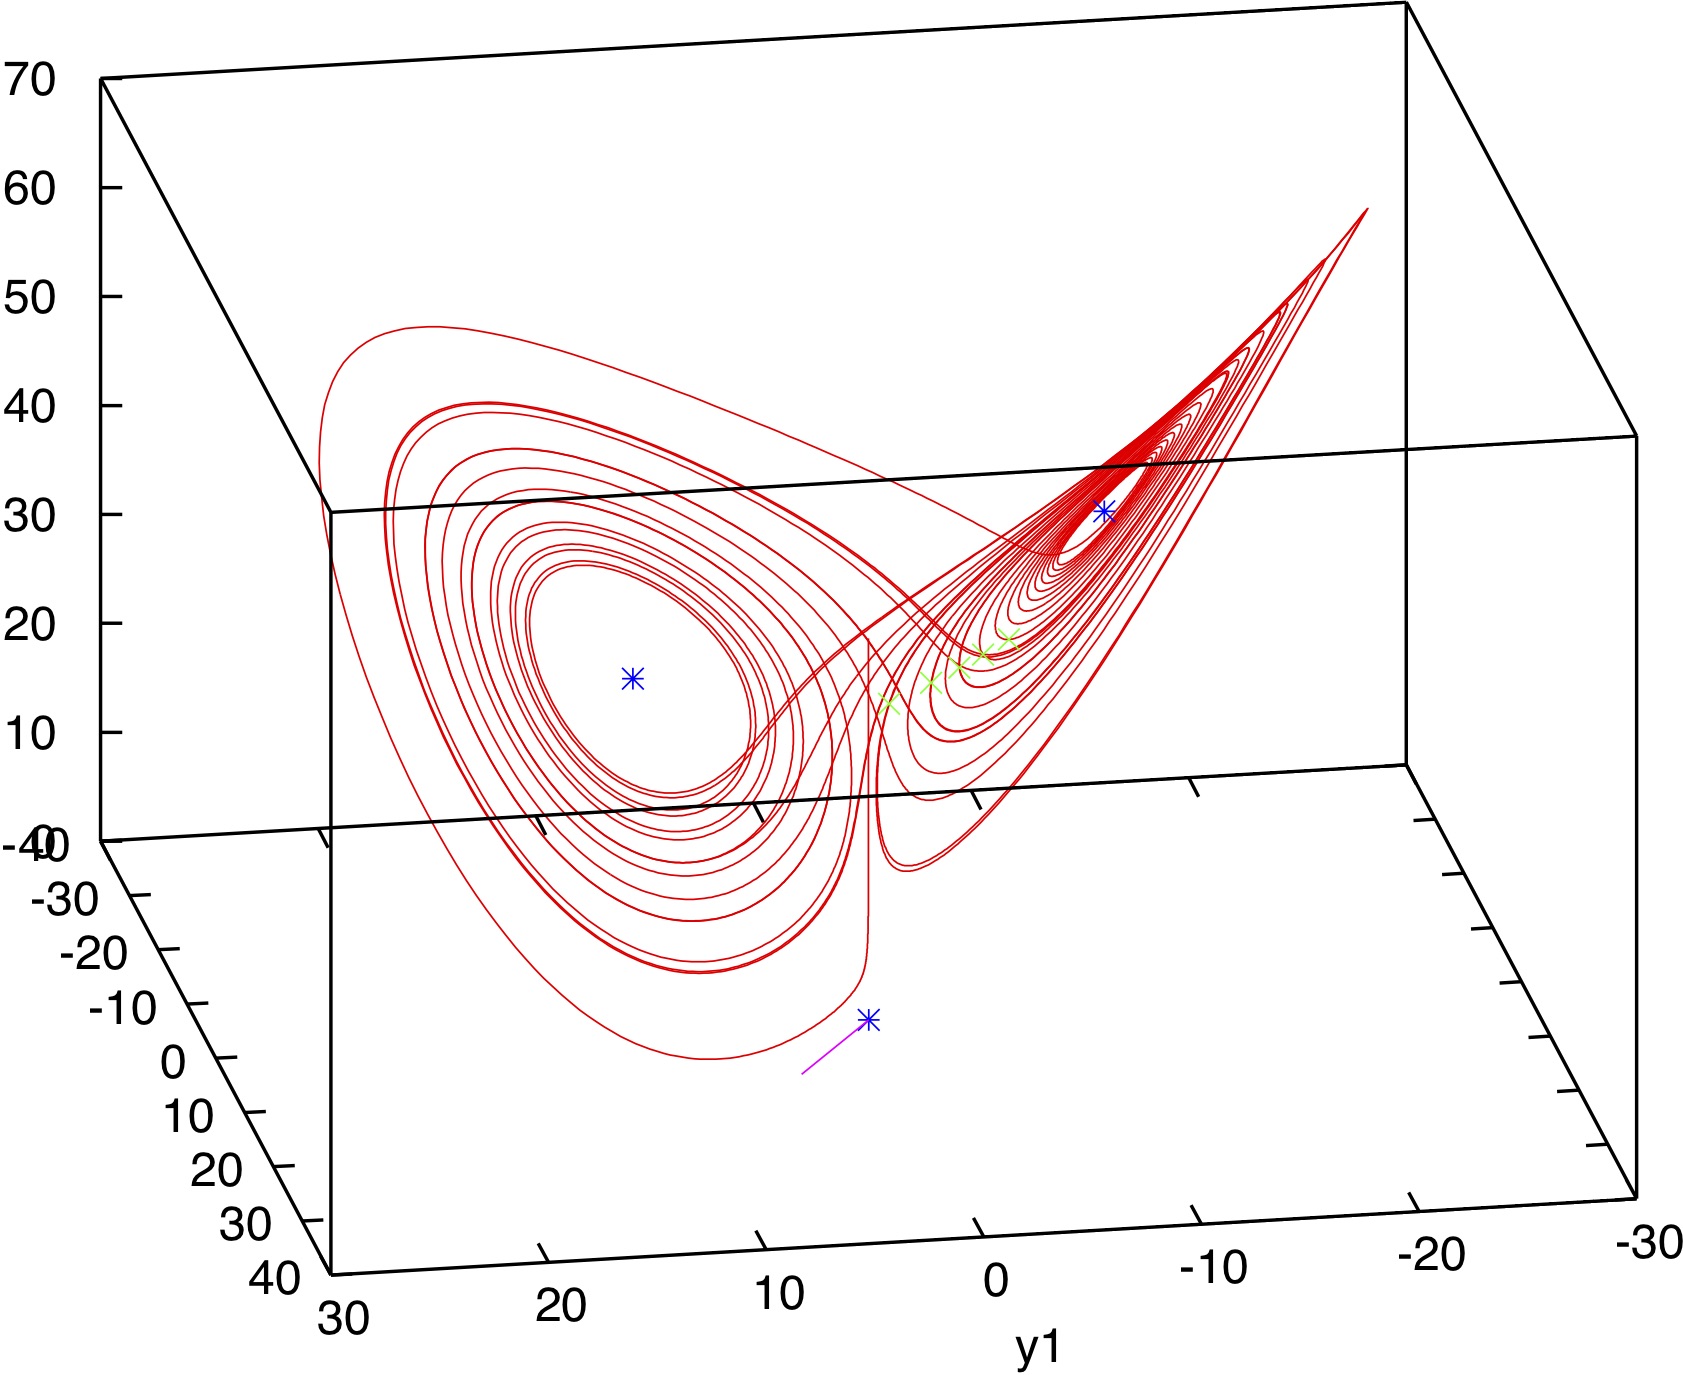
| Lorenz Equation (Example 1.7, page 23, page 85) | |
| Figure 1.15 | phase space, local dynamics at (0,0,0) pdf jpg gif |
| Figure 1.16 | phase space, local dynamics at the nontrivial equilibrium pdf jpg gif |
| Figure 1.17 | phase space, numerical simulation, with points hitting the plane z=29 pdf jpg gif |
| same, another view pdf gif | |
| same, planar view pdf gif | |
| Figure 2.35 | bifurcation diagram (detail) pdf jpg gif |
| Voltage Collapse (Example 3.8, page 159) | |
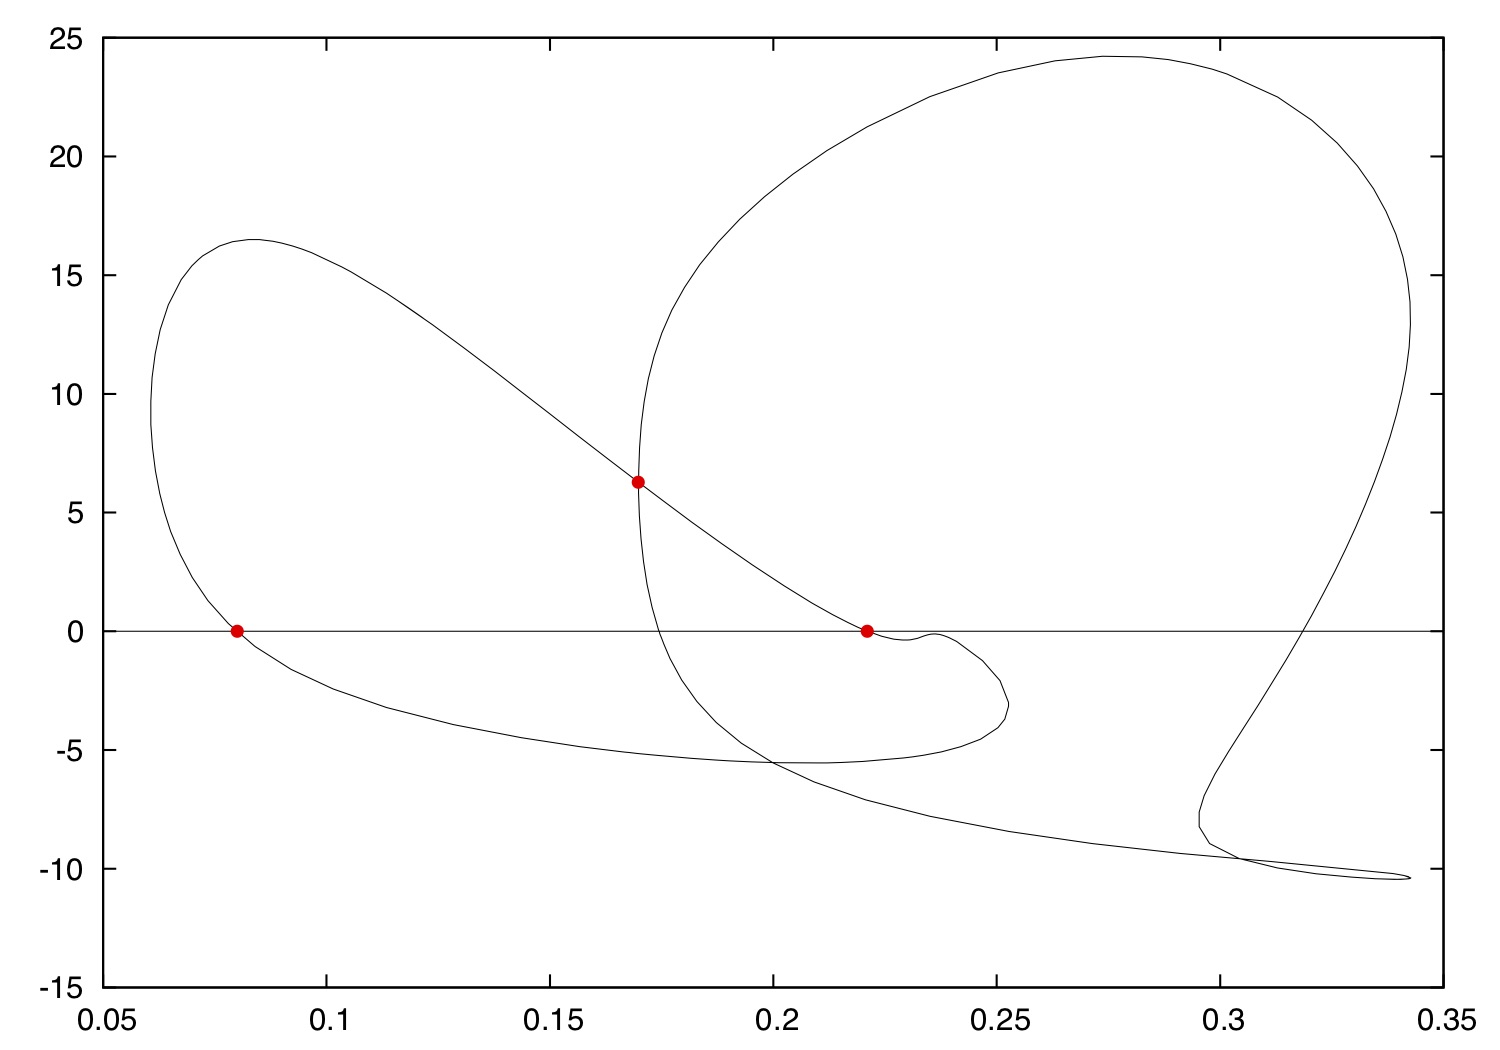
| Figure 3.27 | phase plane, parameter=2.5588 pdf jpg gif |
| Figure 3.27 | phase plane, parameter=2.5665 pdf jpg gif |
| Figure 3.28 | V(t), voltage collapse, parameter grows pdf gif |
| Figure 3.26 | bifurcation diagram pdf jpg gif |
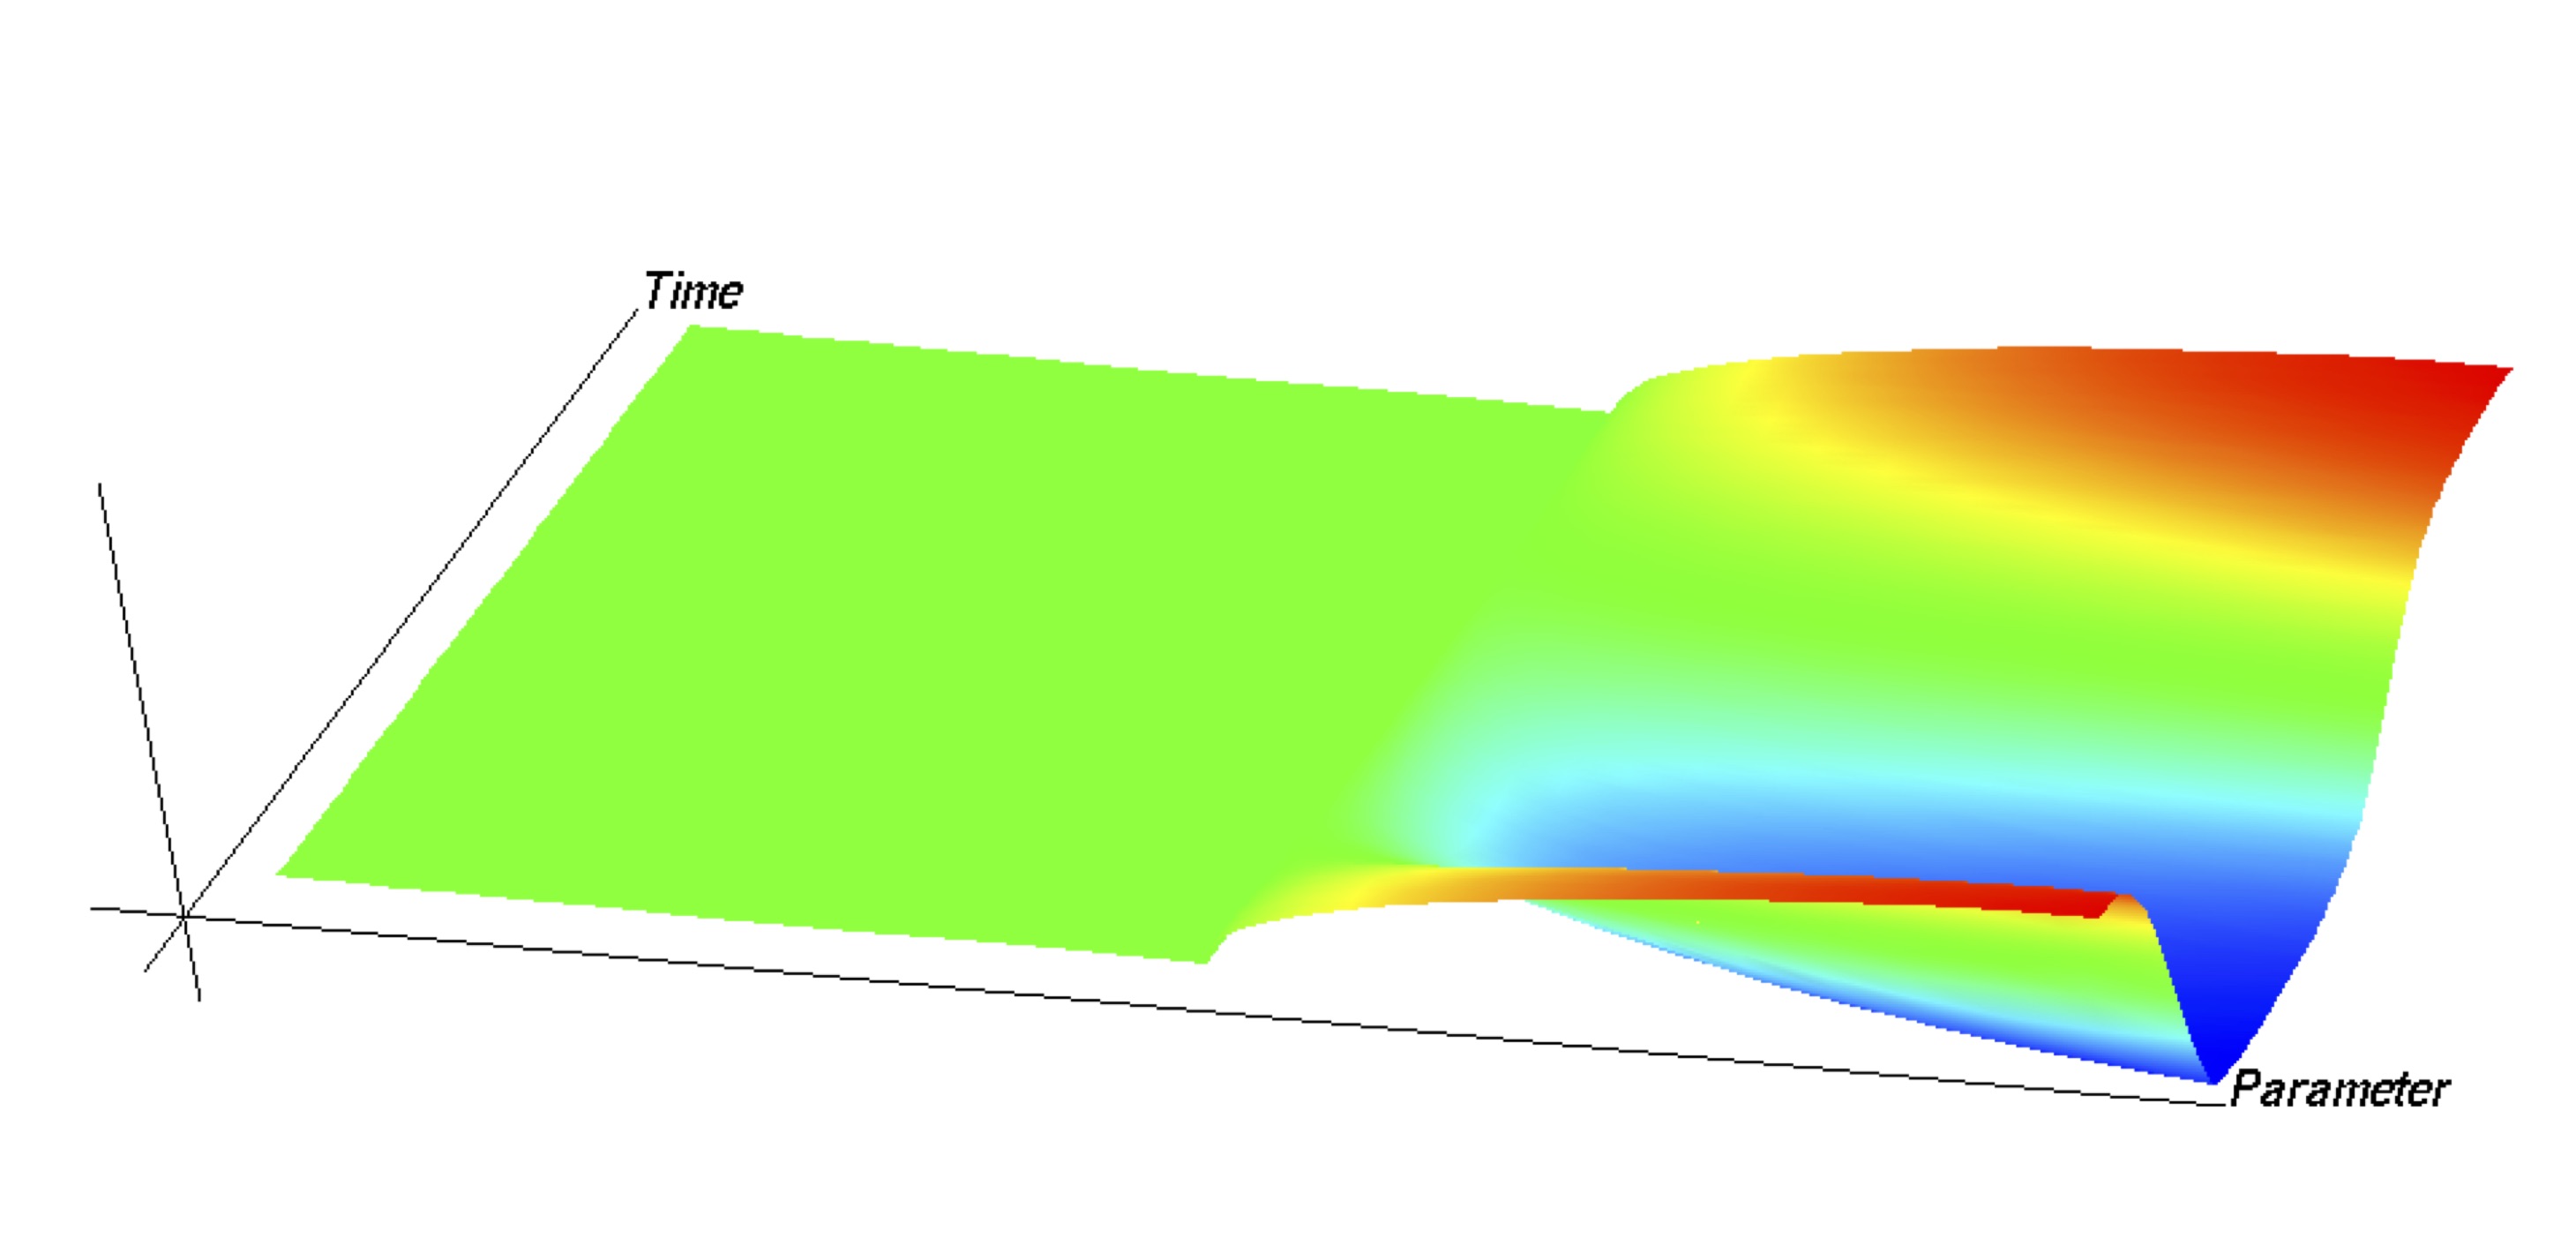
| Autocatalytic reaction (Example 7.15, page 342) | |
| Figure 2.25 | stable solutions close to Hopf bifurcation (b&w) pdf gif |
| Figure | the same as colored surface pdf jpg gif |
| Figure | bifurcation diagram (detail) pdf jpg gif |
| Isothermic Reaction (Example 7.8, page 325) | |
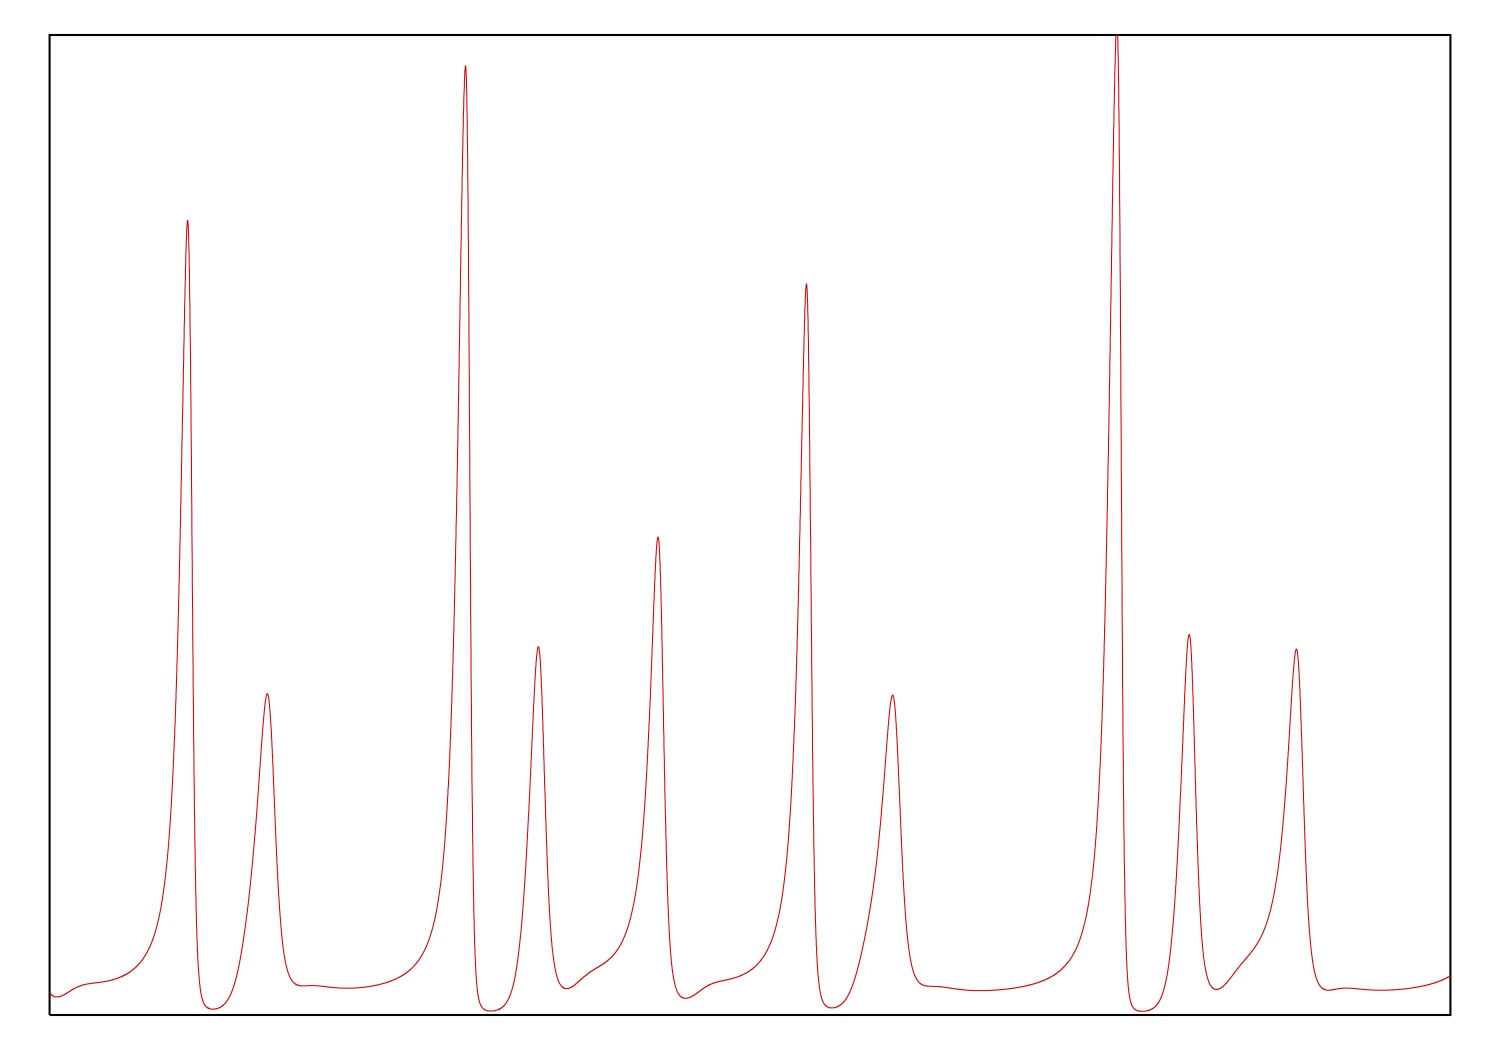
| Figure 1.5 | y_1(t) for parameter=11. pdf jpg gif |
| Figure 1.5 | y_1(t) for parameter=10.55 pdf jpg gif |
| Figure 1.5 | y_1(t) for parameter=10.11 pdf jpg gif |
| Figure 1.5 | y_1(t) for parameter=9.9 pdf jpg gif |
| Figure 7.17 | bifurcation diagram (detail) pdf jpg gif |
| Figure | bifurcation landscape pdf gif |
| Hodgkin-Huxley Nerve Model (Section 3.4.1, pages 138-141) | |
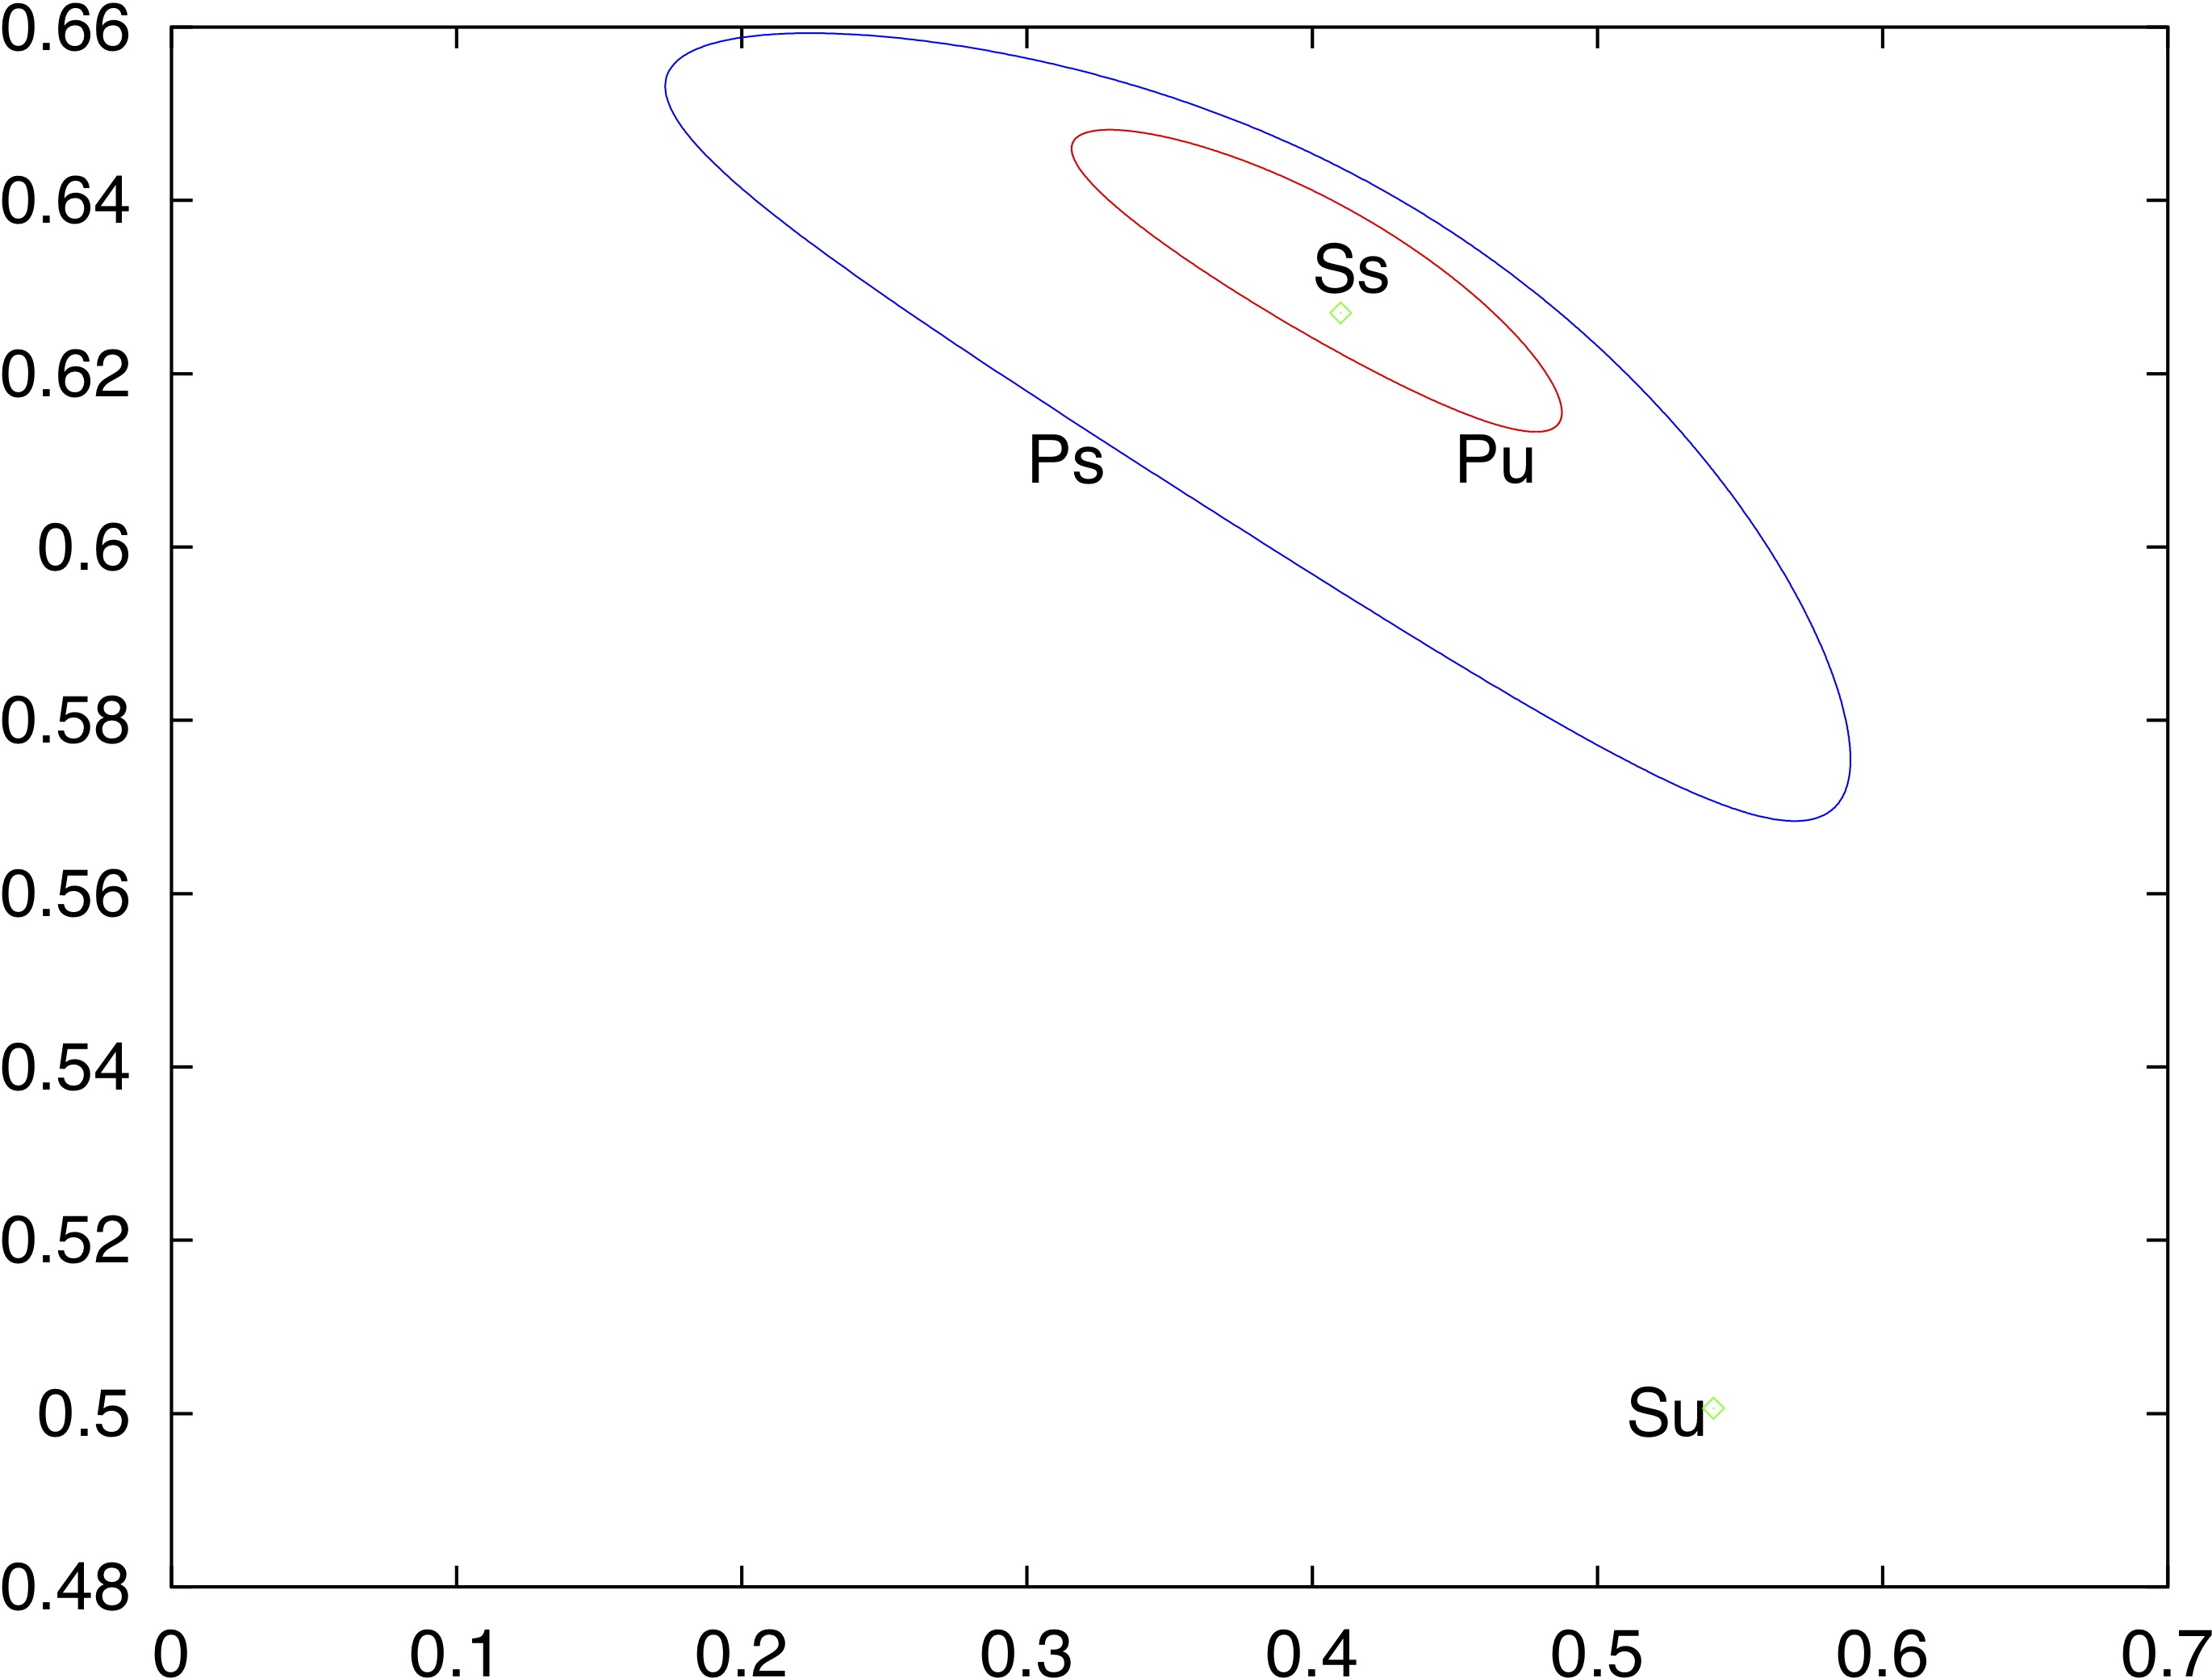
| Figure 3.15 | phase plane pdf jpg gif |
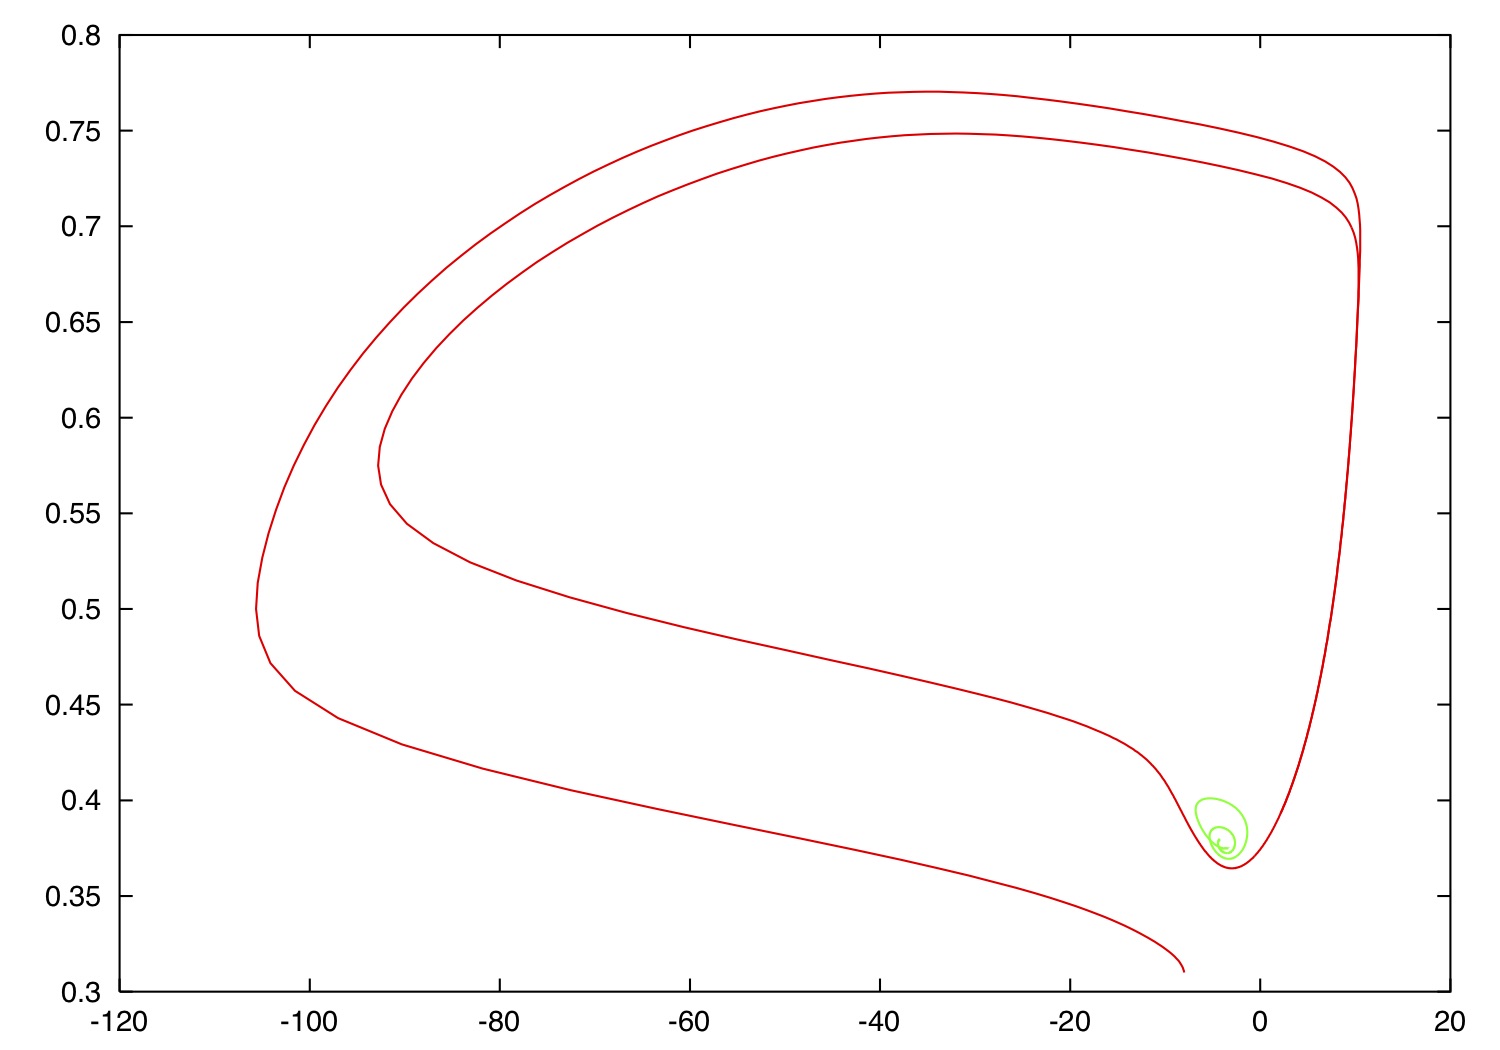
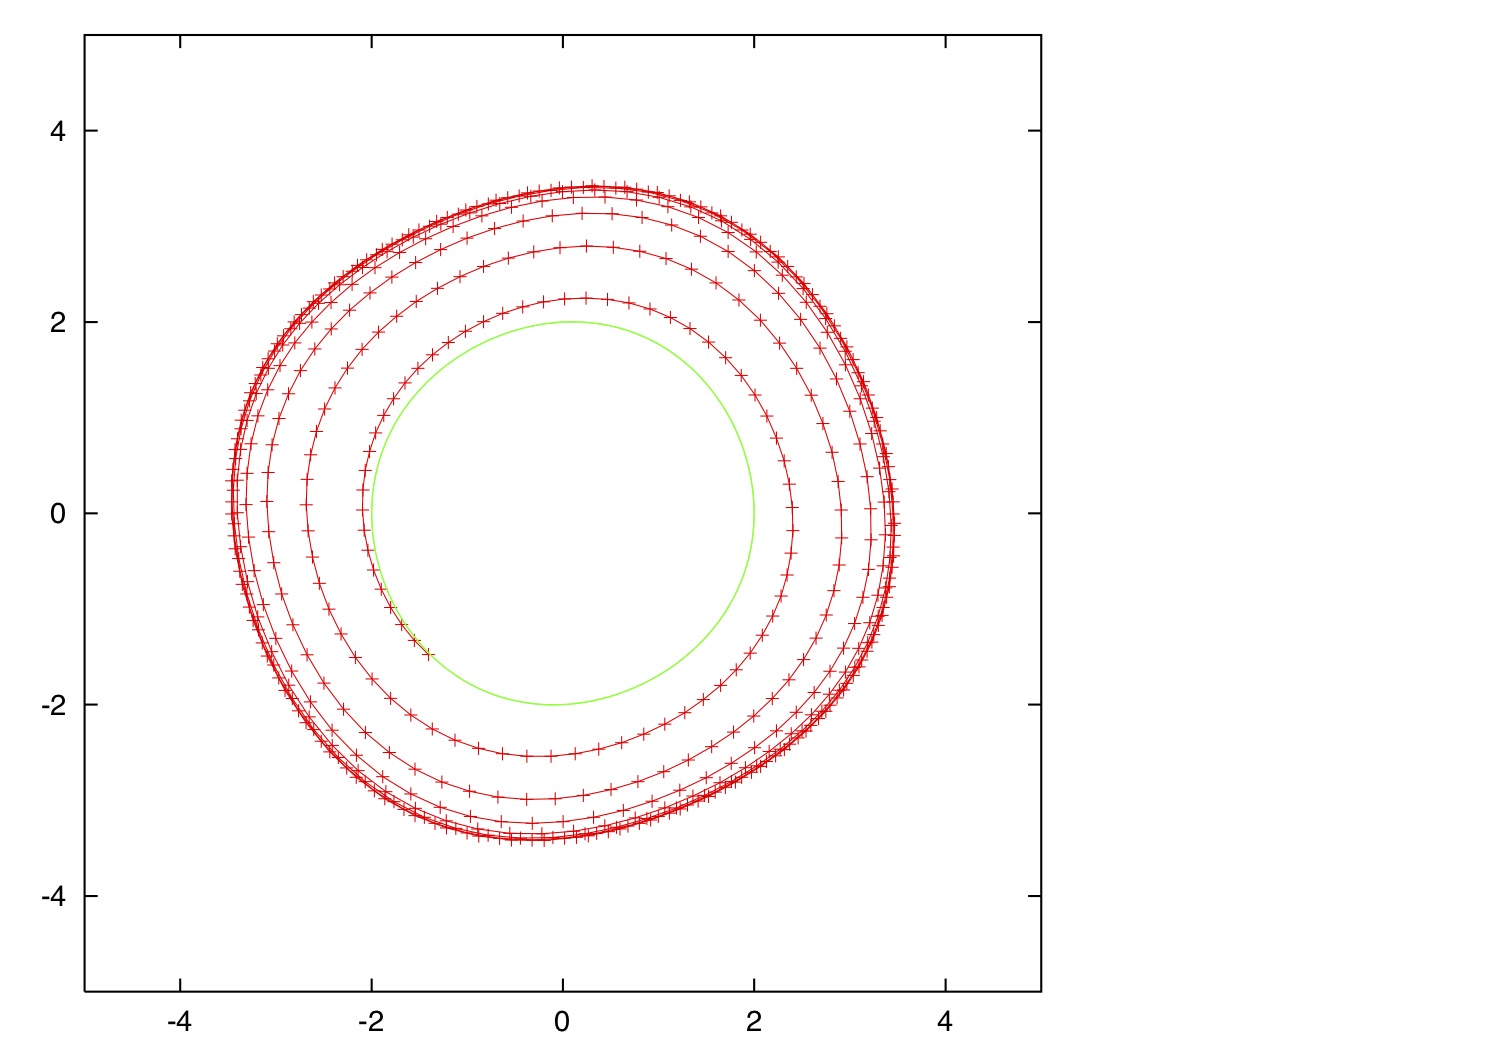
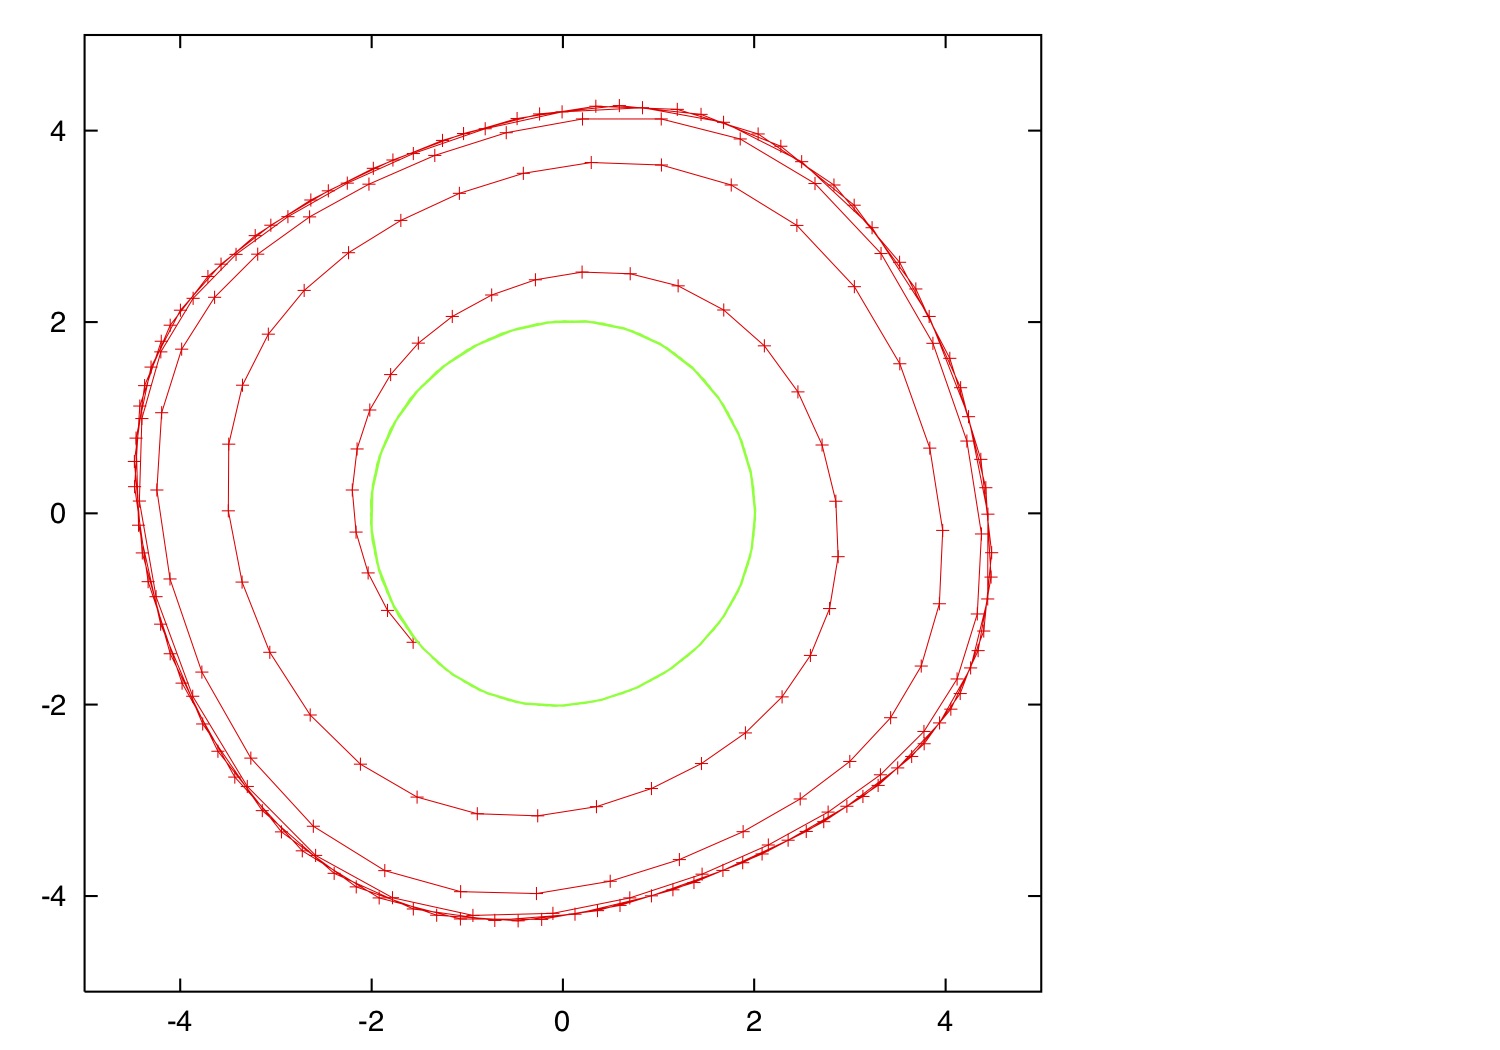
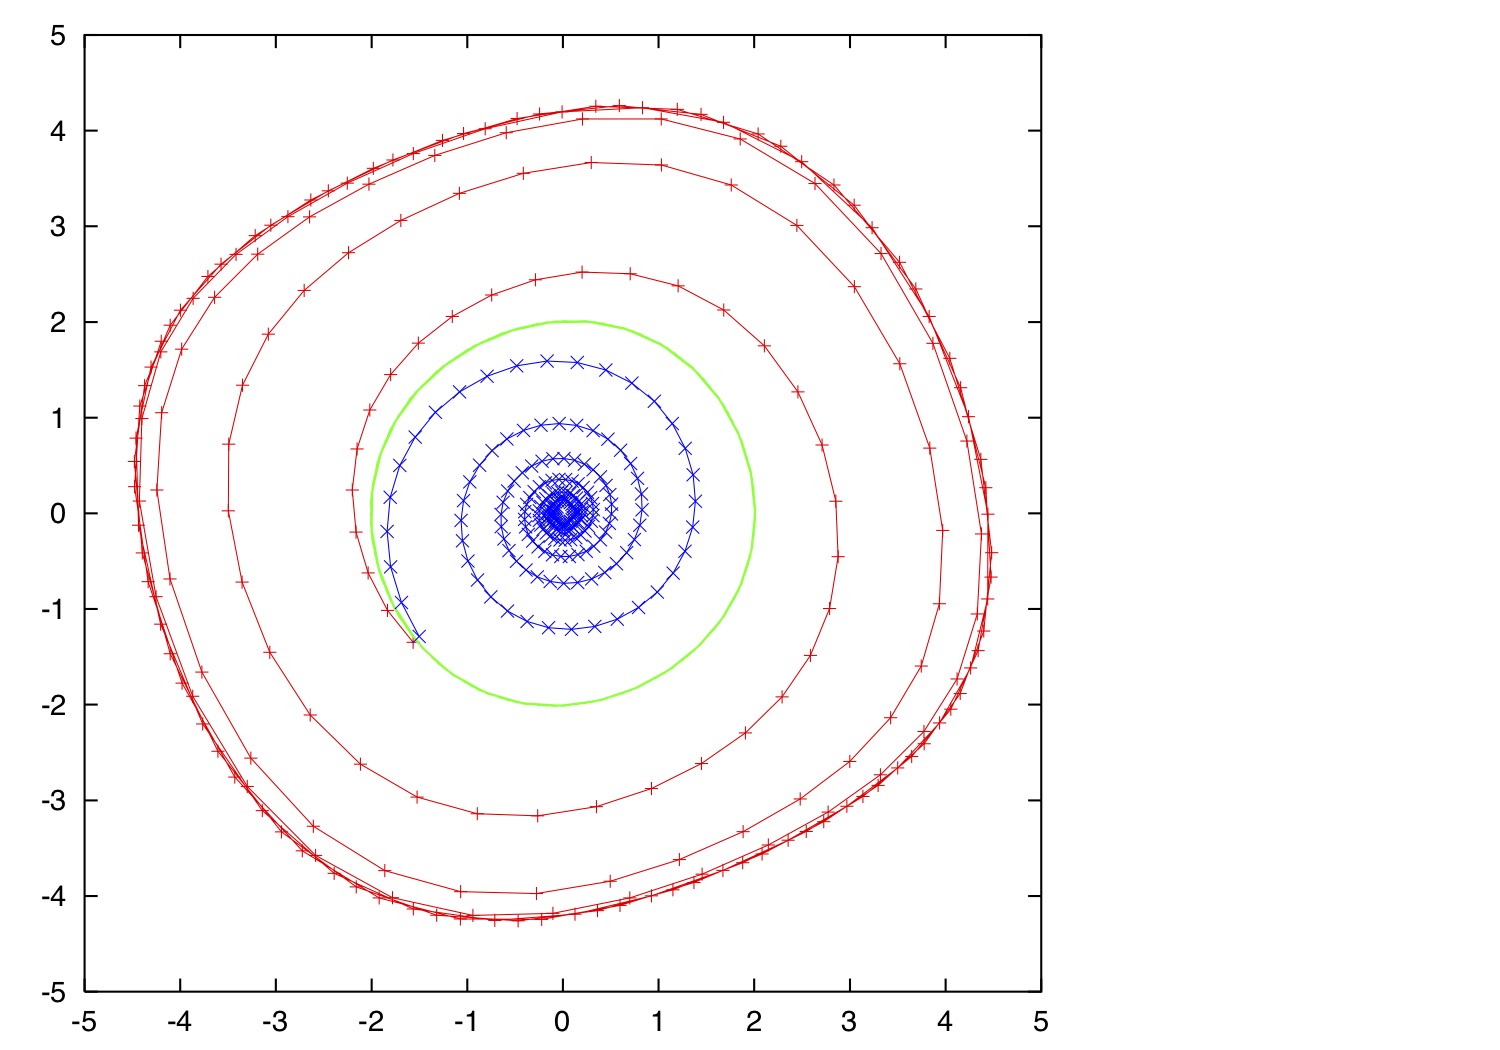
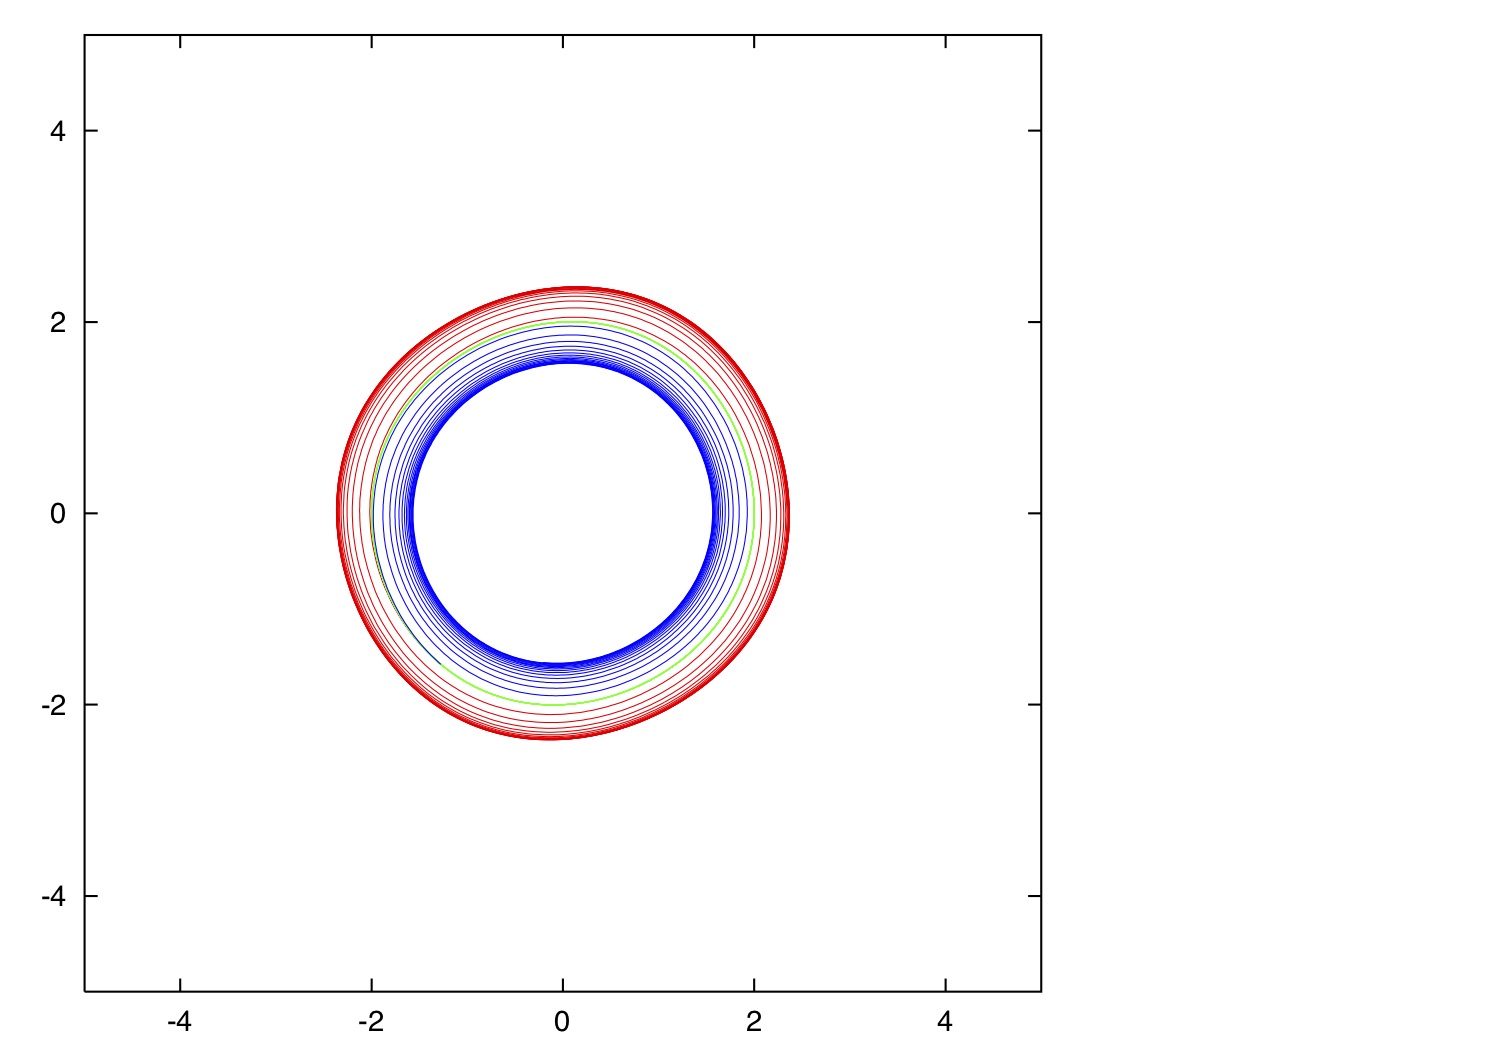
| Numerical Integration of Van der Pol Eq. (Section 1.5.2, pages 43, 44) | |
| (green curve: the limit cycle) | |
| Figure 1.21 | explicit Euler scheme for step length 0.1 pdf jpg gif |
| Figure 1.21 | explicit Euler scheme for step length 0.2 pdf jpg gif |
| Figure 1.22 | explicit (red) and implicit (blue) Euler for step length 0.2 pdf jpg gif |
| Figure 1.22 | explicit and implicit Euler for step length 0.02 pdf jpg gif |