Pictures and Illustrations
© R. Seydel 1994-2004, P. Heider 2003
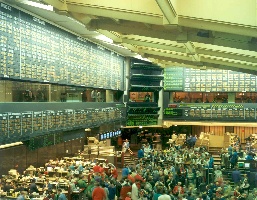
The figures and photographs may be downloaded and used, but only with correct quoting!Photographs:(right-hand photo: floor of the CBOT, Chicago Board of Trade, 1994)

|
Pictures and Illustrations© R. Seydel 1994-2004, P. Heider 2003The figures and photographs may be downloaded and used, but only with correct quoting!Photographs: |
 |
| No. of figure | file | data | |||
| 6th ed. | 1st ed. | ||||
| 1.5 | 1.4 | Am. put, T=1, K=10, r=0.06, vola=0.3 | |||
| 1.6 | 1.5 | Eur. put, T=1, K=10, r=0.06, vola=0.3 | |||
| -- | 1.5 | Eur. put, T=1, K=10, r=0.06, vola=0.3, extended to 3-d for 0 < t < 0.9 | |||
| 1.11 | 1.10 | Am. put, T=1, K=10, r=0.06, vola=0.3, binomial tree, M=32 | |||
| 1.18 | 1.16 | 10 paths of a geometric Brownian motion | |||
| 1.22 | 1.18 | lognormal densities | |||
| 1.26 | 1.20 | binomial tree with payoff | |||
| -- | -- | Am. put, T=1, K=10, r=0.06, vola=0.1 (blue), 0.3 (green), 0.5 (red), for t=0 | |||
| 2.10 | -- | correlated two-component process, rho=0.85 | |||
| Exercise | 2.3 | RANDU number generator, 1000 points seen under two different angles | |||
| 3.1 | -- | Monte Carlo illustration with 5 simulations, r=0, vola=0.2 | |||
| 3.6 | -- | simulating a 2D binary option | |||
| 3.7 | -- | 2D binary-option value function | |||
| 3.13 | -- | Monte Carlo setting for regression methods | |||
| 3.15 | -- | fictive regression situation | |||
| 4.5 | 4.5 | value of a put, schematically | |||
| 4.8 | 4.7 | early-exercise and other curves in the (S,t) decision plane | |||
| 4.9 | 4.8 | Am. call, T=1, K=10, r=0.25, vola=0.6, dividend flow=0.2 | |||
| 4.12 | -- | Crank-Nicolson approximation "at the corner" | |||
| 4.13 | 4.11 | Am. put, T=1, K=10, r=0.25, vola=0.6, , dividend flow=0.2 | |||
| 4.19 | -- | comparison of methods: costs over error | |||
| 4.20 | -- | approximation of an early-exercise curve | |||
| 5.8 | -- | assembling in 1D setting | |||
| 5.9 | -- | 2D hat function | |||
| 5.10 | -- | value function of a basket double barrier | |||
| 5.12 | -- | approximation spaces | |||
| 6.5/6.6 | 6.1/6.2 | Eur.call, T=1, K=13, r=0.15, vola=0.01, centered difference scheme | |||
| 6.8/6.9 | 6.4/6.5 | Eur.call, T=1, K=13, r=0.15, vola=0.01, upwind scheme scheme | |||
| 7.1 | -- | difference in value function due to transaction costs | |||
| 7.2 | -- | Avellaneda's uncertain volatility: butterfly spread | |||
| 7.3 | -- | Avellaneda's uncertain volatility: up-and-out barrier call | |||
| App.E.1 | -- | bounding curves for standard options |