In a previous snapshot, the two-dimensional energy balance model has been already presented:\begin{align*}
C(\hat{r})\frac{\partial T(\hat{r},t)}{\partial t} +A+BT(\hat{r},t)= \nabla\cdot(D(\hat{r})\nabla T(\hat{r},t)) + QS(\hat{r},t)(1-a(\hat{r}))
\end{align*}
The model is based on the assumption of a static surface distribution of the surface types land, ocean, sea ice and snow. However, climate change at an increasing rate is also affecting surface types seasonally as well as permanently over the years. Melting ice and snow masses worldwide are a consequence of this, affecting not only snow and sea ice distribution, but also that of oceans and land surfaces through rising sea ice levels.
Therefore, for more accurate climate modeling with this EBM, it is interesting to modify the model with respect to a time-dependent surface distribution. This modification directly affects the model parameters albedo, solar forcing, and heat capacity, requiring the following reformulation of the model:
\begin{align*}
C(\hat{r},t)\frac{\partial T(\hat{r},t)}{\partial t} +A+BT(\hat{r},t)= \nabla\cdot(D(\hat{r})\nabla T(\hat{r},t)) + QS(\hat{r},t)(1-a(\hat{r},t))
\end{align*}
As part of a bachelor’s thesis, two options were presented for introducing a seasonal sea ice distribution into the EBM by using and modifying simulations from the ‘Klimakoffer‘. Similar approaches are also conceivable for the other surface types.
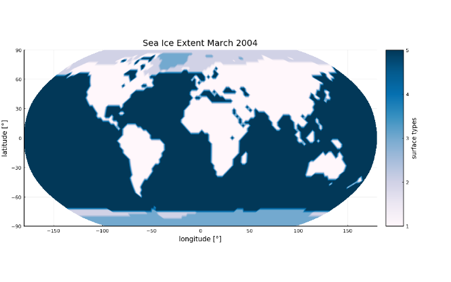
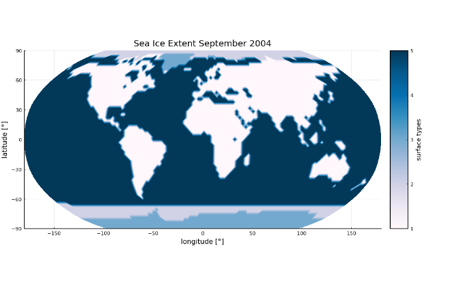
One possibility is to process documented measurements of sea ice distribution, available for example from institutions such as the NSIDC (National Snow and Sea Ice Data Center) or NASA, so that a monthly change in sea ice distribution at the edge of the sea ice extent at the two poles can be mapped using a specially developed algorithm.


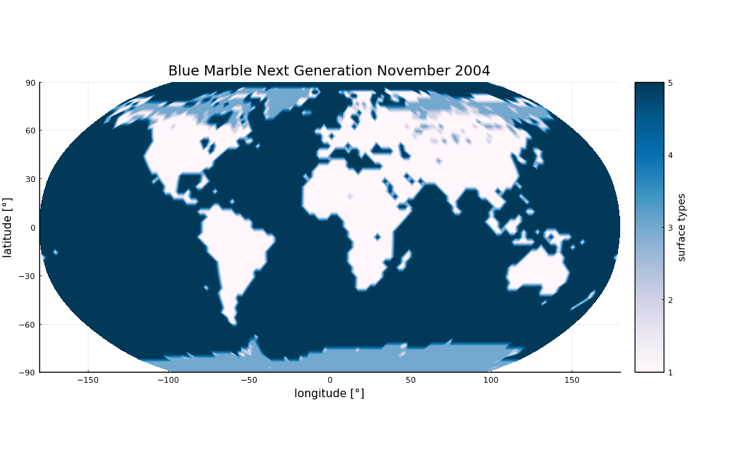
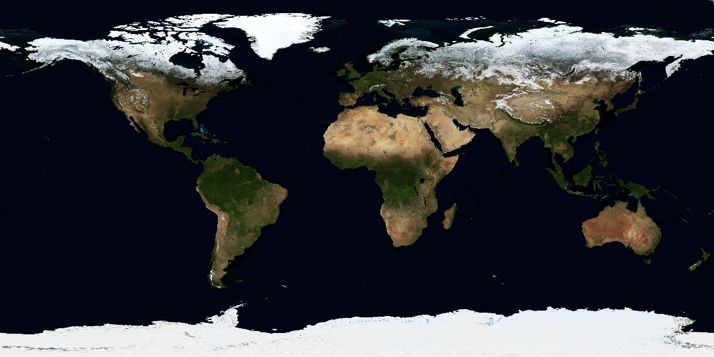
A second option is to directly read in satellite images and categorize the color values of the image’s pixels and map them to the surface types required in the EBM. Here, as an example, a satellite image of the Blue Marble series from 2004 of NASA was read in and categorized on the basis of the color values to the different surface types.

[1] North, G.R.; Mengel, J.G.; Short, D.A. (1983). Simple Energy Balance Model Resolving the Seasons and the Continents’ Application to the Astronomical Theory of the Ice Ages. Journal of Geophysical Research.
[2] Zhuang, K.; North, G.R.; Stevens, Mark J. (2017). A NetCDF version of the two-dimensional energy balance model based on the full multigrid algorithm. SoftwareX.
[3] EOS Project Science Office at NASA Goddard Space Flight Center, Blue Marble Next Generation, 2004, https://visibleearth.nasa.gov/collection/1484/blue-marble.
